AI Stock Trading: Build & Test Your Strategy No-Code
AI stock trading is a broad term that covers everything from fully autonomous machine-learning systems to simple rule-based bots that execute orders when a price crosses a moving average. For most retail traders, the practical version is closer to the latter — and that's not a limitation. Rule-based algorithmic trading is transparent, testable, and entirely buildable without writing a single line of code.
This guide explains how automated trading strategies actually work, what separates auditable logic from opaque black-box tools, and how to construct, backtest, and launch your own strategy using a no-code visual builder.
What Is AI Stock Trading?
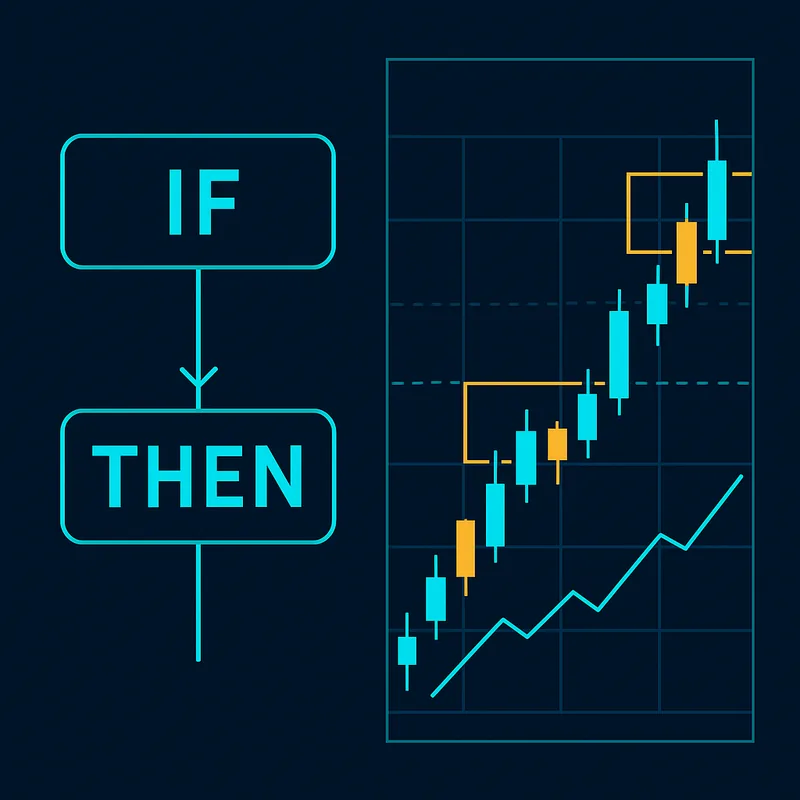
AI stock trading refers to using software to automate trading decisions — monitoring markets, evaluating conditions, and placing orders without manual intervention. The term "AI" gets applied loosely. In practice, it describes two very different things:
- True machine-learning AI: Systems that train on historical data to discover patterns, adapt over time, and make predictions. These are largely the domain of institutional quant funds.
- Rule-based algorithmic automation: Systems that execute predefined logic — "if RSI drops below 30 and price is above the 200-day moving average, enter a long position." This is what most retail trading bots actually do.
The distinction matters because rule-based stock market automation is auditable. You can see exactly what the bot will do and why. Black-box AI, by contrast, gives you outputs with no explanation — which makes it nearly impossible to diagnose when things go wrong.
For traders without a programming background, rule-based automation is the realistic, practical entry point into automated trade execution.
How AI Stock Trading Works
From Indicator to Order: The Logic Chain
Every automated trading strategy is a chain of conditions. The bot continuously monitors the market, evaluates whether your conditions are true, and fires an order when they are. That chain typically looks like this:
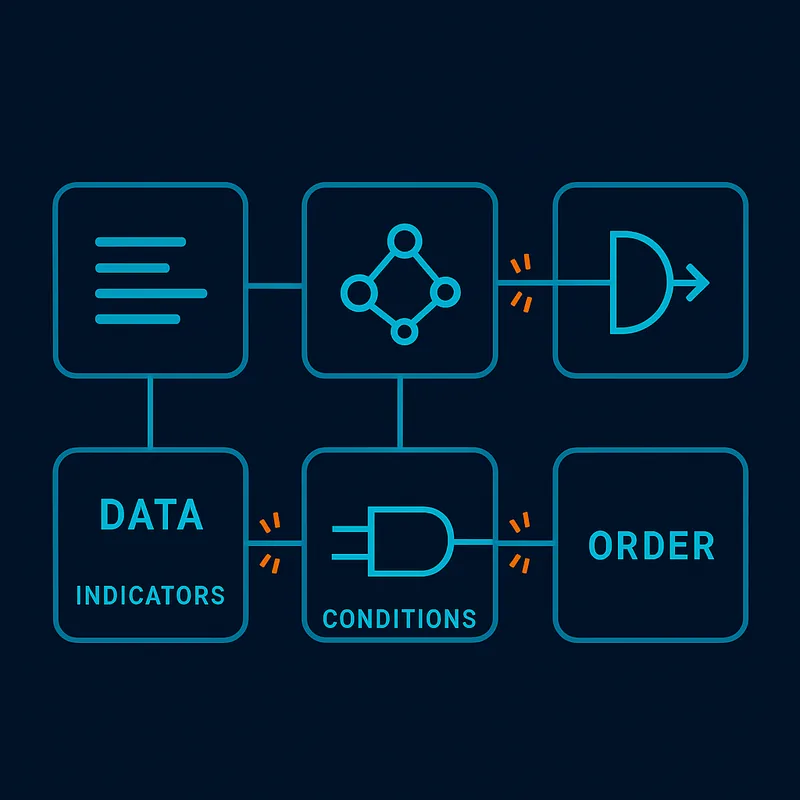
- Market data feeds in — price, volume, and indicator values update in real time.
- Conditions are evaluated — the bot checks whether your defined rules are met (e.g., a moving average crossover, an RSI threshold, a volume spike).
- A signal triggers — when all conditions in a rule are satisfied, an entry or exit signal fires.
- An order executes — the bot places a buy, sell, or stop order automatically.
Trading indicators — mathematical calculations applied to price and volume data (like MACD, Bollinger Bands, or the Relative Strength Index) — are the raw inputs that conditions are built from.
What Happens When a Condition Triggers
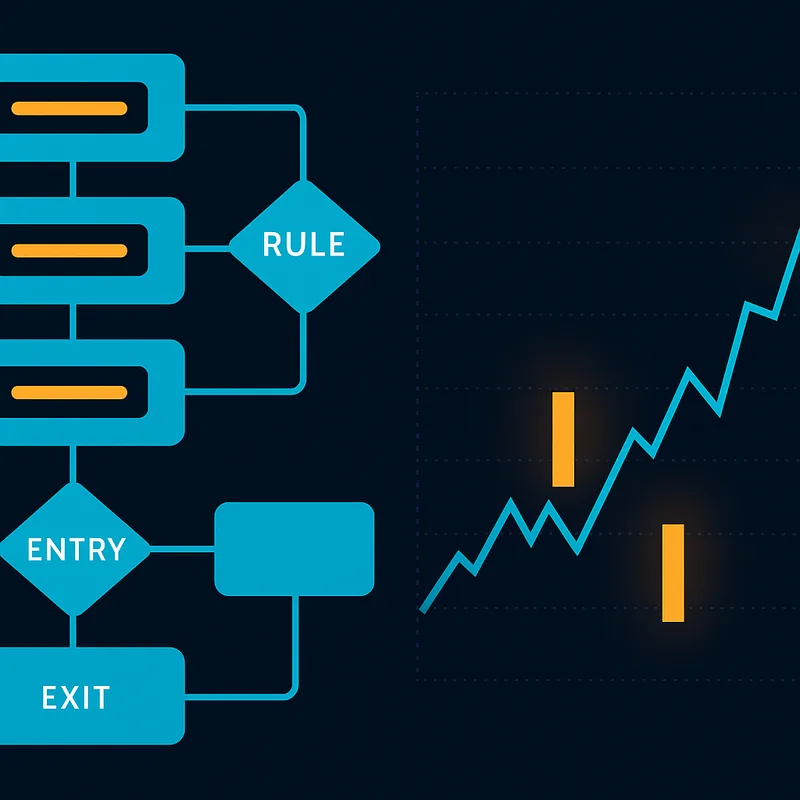
In a well-designed system, every trigger is visible. A deal map — a visual representation of your strategy's logic flow — shows how conditions connect: which indicators feed which rules, which rules control entries, which control exits. When a condition fires, you can see exactly where on the chart it happened and why.
This on-chart visibility is what separates a strategy you understand from one you're just hoping works.
Does AI Actually Work for Stock Trading?
The honest answer: rule-based automation works when the logic is sound, the conditions are validated, and the trader understands what the system is doing. It doesn't work as a passive income machine you set and forget.
The most reliable evidence standard is backtesting — running your strategy against historical price data to see how it would have performed. Backtesting lets you:
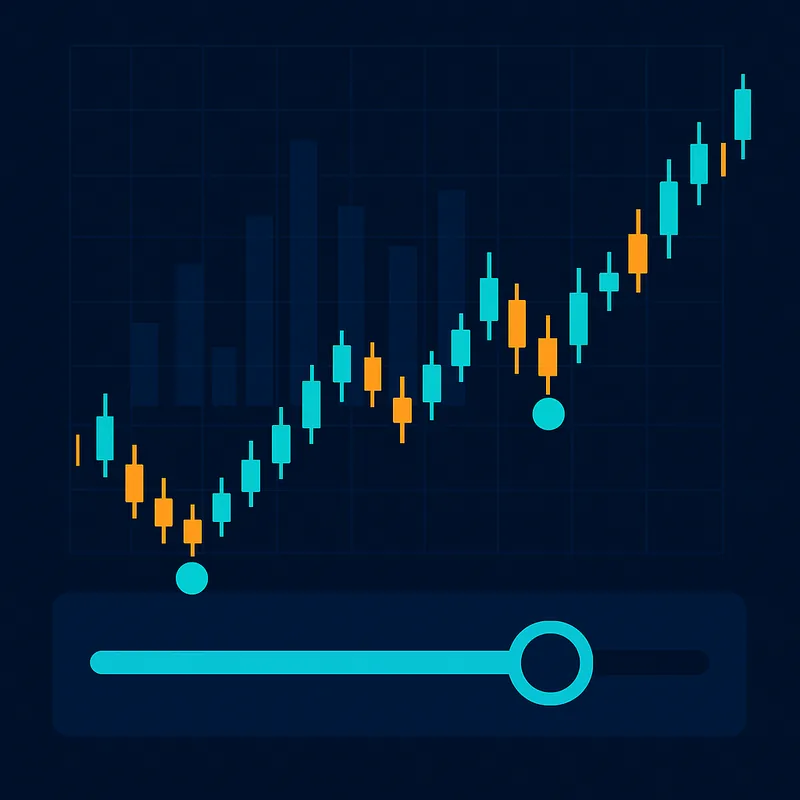
- Confirm that your entry and exit signals actually fired at the right moments
- Measure win rate, average return per trade, and maximum drawdown
- Identify whether the logic holds across different market conditions
On-chart trigger visibility is critical here. A backtest that just shows you a P&L curve tells you little. A backtest that highlights every point on the chart where a rule triggered — and why — gives you auditable strategy logic you can actually learn from and improve.
Risk management rules (position sizing, stop-losses, maximum daily loss limits) are non-negotiable. A strategy without them isn't a strategy — it's a bet.
Realistic expectations: no strategy wins every trade. A well-backtested rule-based system with clear logic and disciplined risk rules is a repeatable process, not a guarantee.
Types of AI Trading Tools and Bots
Black-Box Bots vs. Visual Strategy Builders
The trading tool landscape breaks into a few broad categories:
| Tool Type | How It Works | Transparency |
|---|---|---|
| Black-box AI platforms | Proprietary algorithms make decisions you can't inspect | None |
| Code-heavy platforms | You write Python or Pine Script to define logic | Full, but requires programming skill |
| Parameter-buried platforms | Sliders and dropdowns with no view of underlying logic | Partial |
| No-code visual builders | Drag-and-drop condition interfaces with on-chart debugging | Full |
Black-box bots are the riskiest category for retail traders. When performance degrades — and it will during regime changes — you have no way to diagnose the problem or adjust.
What to Look for in an AI Trading Tool
Before committing to any platform, check for:
- Visual debugger: Can you see exactly where rules triggered on the chart?
- Drag-and-drop condition interface: Can you build logic without writing code?
- Nested logic support: Can you combine multiple conditions with AND/OR operators?
- Backtesting on real historical data: Not simulated — actual price history
- Transparent entry and exit rules: Every order should trace back to a visible condition
Quberas is built around this transparency model — a drag-and-drop condition builder with a visual debugger that highlights chart zones tied to each rule, so you always know what the bot is doing and why.
How to Build an AI Stock Trading Strategy Without Code
Step 1: Define Your Entry Conditions
Start with the question: what has to be true for me to want to enter a trade?
In a no-code strategy builder, you construct this using a puzzle-style condition builder — connecting indicator blocks with logical operators. For example:
- RSI (14) crosses below 35 AND
- Price is above the 50-period EMA AND
- Volume is above its 20-period average
Each block snaps together. Nested logic lets you group conditions — (A AND B) OR (C AND D) — without writing a single expression. You can add averaging orders (additional buys at lower prices to reduce average entry cost) as part of the entry logic.
Step 2: Set Exit Rules and Stop-Losses
Entries get attention; exits protect capital. Define:
- Take-profit conditions: e.g., price reaches a 3% gain, or RSI crosses above 70
- Stop-loss rules: a fixed percentage below entry, or a trailing stop that moves with price
- Time-based exits: close the position if it hasn't hit target within N candles
In a drag-and-drop deal map, exit conditions connect directly to the entry block — you can see the full lifecycle of a trade in one view. A stop-loss is not optional; it's the rule that keeps a single bad trade from damaging your account.
Step 3: Visualize the Logic on the Chart
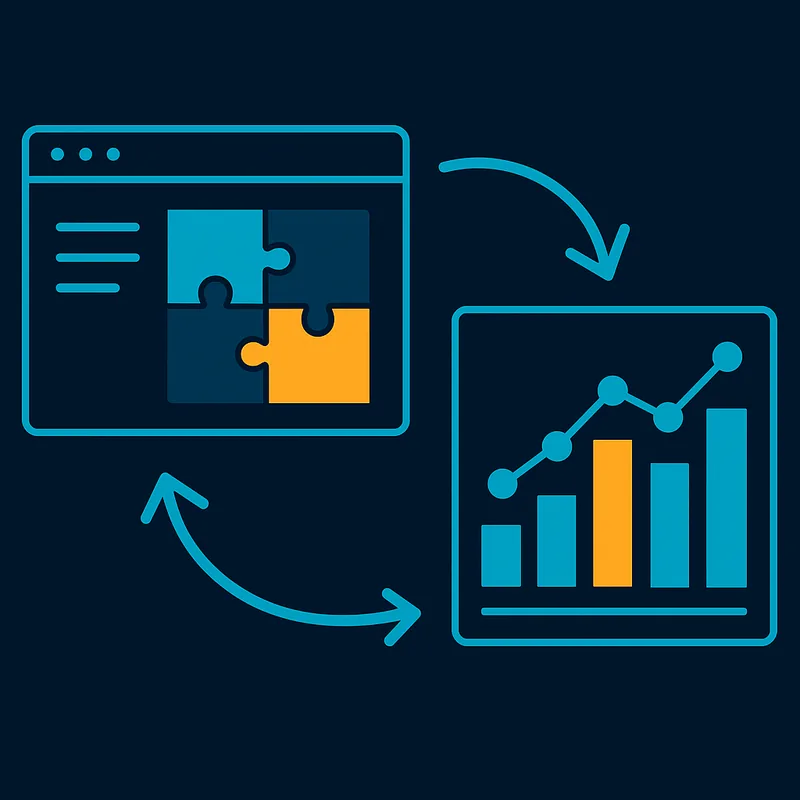
Before backtesting, switch to the chart view. A visual builder should highlight every zone where your entry conditions would have been true — so you can immediately see whether the logic is firing where you intended.
If the entry signals are clustering in the wrong places (e.g., entering during high-volatility news spikes you wanted to avoid), you can adjust the conditions and re-check — all without touching code. This iteration loop is where strategies get refined.
Backtesting Your AI Trading Strategy
Backtesting means running your completed strategy against historical market data to evaluate how it would have performed. It is the non-negotiable step between building a strategy and risking real capital.
A rigorous backtest workflow:
- Select a historical period that includes different market conditions — trending, ranging, and volatile phases.
- Run the backtest and review where entry and exit signals fired on the chart.
- Evaluate key metrics: total return, win rate, maximum drawdown, average trade duration.
- Iterate on logic: if entries are firing too early or exits are leaving profit on the table, adjust the conditions and re-run.
The Quberas backtest workflow keeps every trigger visible on the chart — you're not reading a summary table, you're seeing the strategy's decision history overlaid on real price action. That visibility is what makes strategy validation meaningful rather than superficial.
Risk management parameters should be tested as rigorously as entry logic. A strategy that looks profitable before stop-losses may look very different after realistic slippage and drawdown are factored in.
Risks and Limitations of AI Stock Trading
Automation doesn't eliminate risk — it systematizes it. Know what can go wrong:
- Overfitting: A strategy tuned too precisely to historical data performs well in backtests but fails in live markets. If your rules have 15 conditions and only work on one specific six-month period, they're overfit.
- Market regime changes: A trend-following strategy that worked in a bull market may generate losses in a sideways or bear market. No strategy works in all conditions.
- Execution risk: Live order execution involves latency, slippage, and partial fills that backtests don't fully capture. Real performance will differ from backtest performance.
- Black-box risk: Using a tool you don't understand means you can't fix it when it breaks. Auditable logic — being able to trace every order back to a visible condition — is a practical risk control.
- Over-automation: Removing all human oversight creates blind spots. Automated strategies should be monitored, not abandoned.
Realistic expectations and disciplined risk management — position sizing, stop-losses, maximum exposure limits — are what separate sustainable automation from gambling with a bot.
How to Get Started with AI Stock Trading
The barrier to entry is lower than most traders assume. You don't need to learn Python, hire a developer, or trust a black-box system. Here's a practical starting path:
- Pick one strategy concept you already trade manually — a moving average crossover, an RSI reversal setup, a breakout pattern.
- Open a no-code strategy builder and translate that concept into conditions using the drag-and-drop interface.
- Define your exit rules and stop-loss before you do anything else.
- Visualize the logic on the chart — confirm the rules fire where you expect.
- Run a backtest on historical data — evaluate the results, iterate on the conditions, and re-test.
- Go live only after validation — never deploy a strategy you haven't backtested across multiple market conditions.
The entire process — from first condition to validated backtest — can be completed without writing a single line of code.
Ready to build your first AI trading strategy without writing a single line of code? Try Quberas — construct your logic visually, backtest it on real chart data, and see exactly where your rules fire before you go live.