What Is a Bull Market? Trade It Systematically
A bull market is a sustained period where asset prices rise broadly, usually accompanied by rising investor confidence and the expectation that the trend will continue. It's not a single-day rally or a good earnings report — it's a market regime that can last months or years, and it shapes how traders should size positions, choose entries, and manage risk. This guide covers what officially defines a bull market, what drives one, how it differs in crypto versus stocks, and how to turn "the trend is up" into a rules-based, backtested strategy instead of a gut call.
What Is a Bull Market?

A bull market describes a stretch of time when prices in a market — a stock index, a single asset, or a whole asset class like crypto — trend upward over a sustained period, not just a few sessions. The term is used loosely in daily financial commentary, but it has a specific meaning to analysts: a broad, sustained price increase driven by improving investor confidence and sentiment. When investors expect earnings, growth, or adoption to keep improving, they buy more and sell less, which pushes prices higher and reinforces the same expectation. That feedback loop — rising prices, rising confidence, more buying — is the mechanical heartbeat of a bull market.
The opposite condition, a sustained decline, is called a bear market, which we'll define precisely in a later section. For now, the key point is that a bull market is a directional regime, not a single event, and recognizing it requires looking at price action over weeks and months rather than days.
How a Bull Market Works: The 20% Rule
Why 20% Is the Benchmark
The most widely used technical definition of a bull market is a 20% price rise from a recent low, typically measured on a broad index. This threshold gives analysts and traders a consistent, quantifiable line instead of relying on a subjective "it feels bullish" call. The 20% figure isn't arbitrary sentiment-chasing — it's large enough to filter out routine short-term rallies and pullbacks, so only genuine trend shifts qualify. Applied to the S&P 500, this means that if the index falls to a low point and then climbs 20% off that low, the index is officially considered to have entered a bull market.
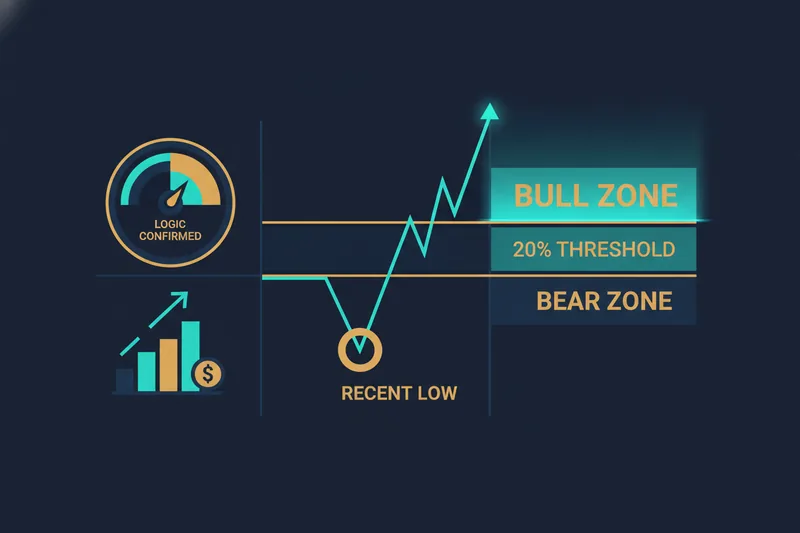
The same 20% logic is applied in reverse to declare the end of a bull market and the start of a bear market: a 20% drop from a recent high flips the label. Because the threshold is symmetric, it works as a shared reference point across both directions of the market cycle.
How Long Bull Markets Typically Last
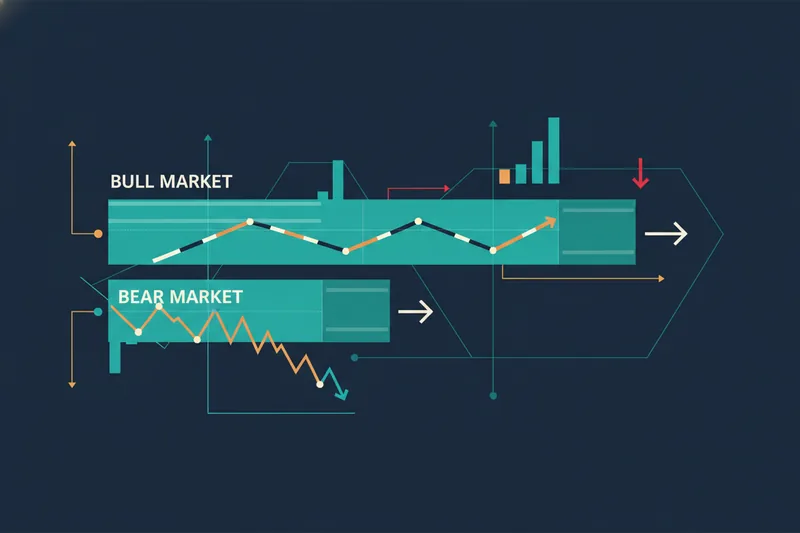
Bull markets vary widely in length and magnitude, but in equities they have historically tended to last considerably longer than bear markets — sometimes for years — because economic expansions and earnings growth tend to unfold gradually rather than snap back overnight. Market cycles move through expansion (bull), peak, contraction (bear), and trough phases, and the bull phase is usually the longest stretch of the cycle in stock markets. That said, duration is not a rule you can trade on directly — it's a historical tendency, not a guarantee that this cycle will match the last one.
Bull Market vs. Bear Market
The core contrast is simple: a bull market is a sustained rise in prices paired with growing confidence, while a bear market is a sustained decline — conventionally also measured against a 20% drop from a recent high — paired with a shift toward pessimism and risk aversion. The two aren't just mirror images in price direction; they represent opposite sentiment regimes. In a bull market, buyers absorb dips and treat bad news as noise. In a bear market, sellers dominate rallies and treat good news with suspicion. Once you've identified which regime you're in, the strategies appropriate to each are different enough that conflating them is one of the most common mistakes retail traders make — a topic covered in more depth in bear market trading strategies.
What Causes a Bull Market?
No single factor creates a bull market; it's usually a combination of forces reinforcing each other:
- Economic growth — expanding GDP, low unemployment, and rising consumer spending give companies room to grow revenue, which supports higher valuations.
- Monetary policy — lower interest rates reduce borrowing costs and make bonds/cash less attractive relative to equities, pushing capital toward stocks.
- Corporate earnings — when companies consistently beat or grow earnings, it justifies (or fuels speculation about) higher share prices.
- Investor confidence/sentiment — once the above conditions are visible, sentiment shifts from cautious to optimistic, and that optimism itself becomes self-reinforcing as more capital enters the market chasing the trend.
These drivers don't need to all be present at full strength simultaneously, but a durable bull market usually has at least a couple of them working together — a rate cut alone rarely sustains a multi-year rally without earnings or growth backing it up.
Historical Examples of Bull Markets
The clearest recent example is the bull run that began in March 2009 and ran for roughly the next decade, as the S&P 500 recovered from the financial crisis low and climbed on the back of ultra-low interest rates, recovering corporate earnings, and gradually improving economic data. Another widely referenced example is the post-pandemic recovery bull market that started in 2020: after a sharp, fast crash, aggressive monetary stimulus and reopening optimism drove a rapid rebound and extended rally in equities. Both episodes show the same pattern discussed above — a low point, a 20%+ recovery, and a sustained period where confidence and price reinforced each other. They also illustrate that bull markets can start from very different conditions (a slow-building recovery versus a sharp V-shaped rebound) yet still meet the same definitional threshold.
Is the Market Currently in a Bull or Bear Phase?
Rather than trying to predict which phase is coming, it's more useful to have a framework for identifying which phase you're already in. Two categories of signals matter:
- Trend indicators — is the index or asset trading above its longer-term moving averages, and are those averages themselves sloping upward? A sustained series of higher highs and higher lows on a weekly or monthly chart is a basic trend confirmation.
- Sentiment indicators — are earnings reports, economic data, and capital flows generally being read optimistically, or is bad news being punished disproportionately? Sentiment tends to lag price, so use it to confirm a trend rather than to call a turn early.
This framework won't tell you with certainty whether today's market is bull or bear — nobody can call that in real time with full confidence — but combining trend direction with sentiment context gives you a defensible, repeatable way to categorize the current market cycle phase instead of guessing from headlines.
Bull Markets in Crypto: Same Logic, Faster Cycles
The same definition applies to crypto: a crypto bull cycle is a sustained rise in prices across major assets, driven by improving sentiment, adoption narratives, and capital inflows. The mechanics are identical to equities — rising prices reinforcing confidence — but the differences that matter for traders are speed and volatility. Crypto bull cycles tend to compress the equivalent of a multi-year stock bull market into months, with sharper drawdowns inside the broader uptrend. That means the same trend-confirmation logic (higher highs, sustained moves above key moving averages) still applies, but thresholds and stop distances that work for a stock index will often be too tight for crypto's volatility, and market cycles can rotate from euphoria to correction far faster than in traditional equities.
How to Trade a Bull Market: Strategies and Tools
Once you've identified an established uptrend, the practical question is how to participate without relying on discretionary judgment call after call. Two structural approaches dominate:
- Trend-following entries — enter when price confirms the direction of the trend, rather than trying to pick the exact bottom.
- Moving average crossovers — a common trend-following signal is when a shorter-term moving average crosses above a longer-term one, used as a rules-based proxy for "the trend has turned up."
Building a Rules-Based Bull-Market Strategy Visually

Turning that logic into something you can actually trade means defining exact conditions: which moving averages, what crossover confirms entry, and what invalidates the setup. In Quberas, this is done by laying out the logic as a deal map — a visual sequence covering entry conditions, any averaging orders, exit rules, and stop-losses — so you can see the whole trade lifecycle rather than a single indicator in isolation. Conditions like a moving average crossover or a price threshold are built with a puzzle-style condition builder and shown directly on the chart, so you can confirm the rule is triggering where you'd expect before committing capital.
Backtesting Before Trading Live
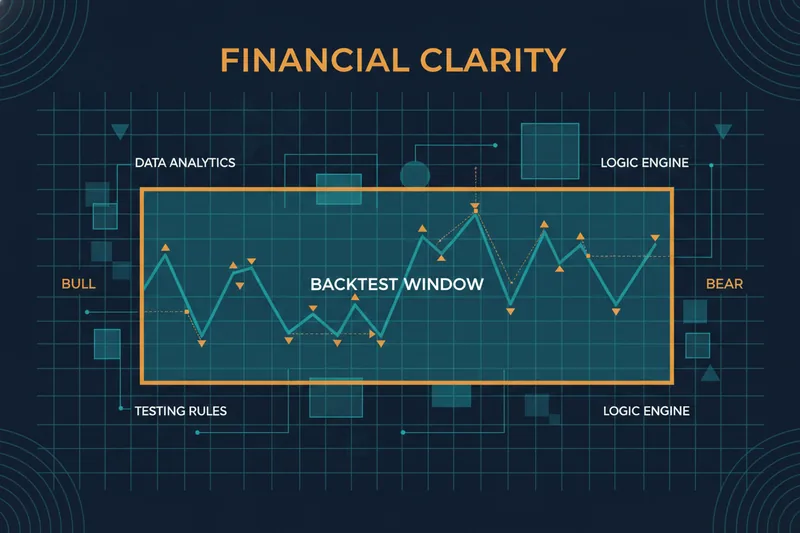
Before trading a trend-following idea live, run it against historical data to see how it would have performed across past bull and bear phases, not just the most recent rally. Backtesting a strategy — testing its rules against historical price data — surfaces whether your entry logic actually captured past bull runs or generated false signals during choppy, sideways stretches. It's the step that separates a strategy that "feels right" from one with a track record.
Managing Risk When the Trend Reverses
Bull markets end. Risk management has to be built into the strategy from the start, not bolted on after a drawdown. A trailing stop — a stop-loss that moves up as price rises, locking in gains while giving the trade room to run — is a standard tool for staying in a trend without giving back the full move when it reverses. Applying stop-loss and cooldown rules at the strategy level, rather than deciding in the moment, keeps a bull-market strategy disciplined once sentiment turns.
Bull Market FAQ
Is it better to buy in a bull or bear market? Buying during a confirmed bull market means aligning with the prevailing trend and sentiment, which historically offers better odds than fighting a downtrend — but entries still need rules (like trend or crossover confirmation) rather than assuming any dip is automatically a buying opportunity.
How do I know a bull market has started? The formal signal is a 20% rise from a recent low, typically measured on a broad index like the S&P 500. Practically, traders confirm this with trend indicators (price above rising moving averages) and improving sentiment, rather than declaring a bull market after a single strong week.
Do bull markets apply to crypto? Yes — a crypto bull cycle follows the same sentiment-driven, sustained-price-increase logic as a stock bull market, but typically moves faster and with larger swings, so trend confirmation and risk parameters need to be adjusted for that volatility.
See how a bull-market strategy performs before risking capital — build and backtest your own trend-following bot visually with Quberas, no coding required.