Bear Market Explained: Trade It Systematically
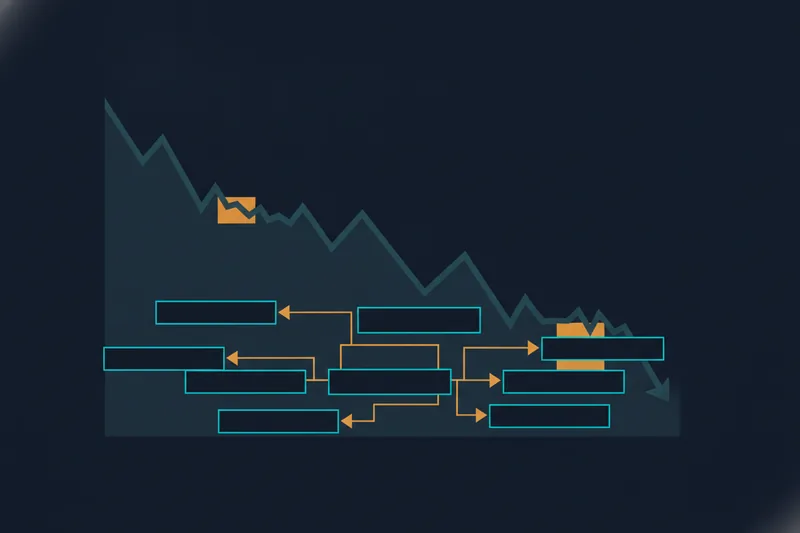
A bear market is a sustained decline of 20% or more from recent highs across a broad index or asset, accompanied by widening pessimism and falling investor confidence. It isn't a single bad week or a sharp red candle — it's a structural shift in investor sentiment that typically drags on for months, sometimes years, and reshapes how both retail and professional traders size positions and manage risk. This guide walks through what actually happens during a bear market, what history shows about past ones, and how to move from anxious waiting to a tested, rules-based plan.
What Is a Bear Market? Definition and Core Mechanics
The 20% decline threshold is the most widely used technical marker: once a major index or asset falls 20% from its most recent peak, analysts label the move a bear market rather than a routine pullback (which is typically a 5–10% dip) or a correction (10–20%). But the number alone doesn't capture the mechanics. What defines the experience of a bear market is the feedback loop between falling prices and deteriorating sentiment — as prices drop, pessimism spreads, selling accelerates, and volatility (the size and frequency of price swings) tends to rise sharply as participants react to every headline.
This is exactly the kind of condition that's hard to reason about in real time and easy to rationalize in hindsight. Traders who try to navigate a bear market on instinct alone are essentially trading their own emotional state — which is the core problem a platform like Quberas is built to remove, by letting you define entry, exit, and risk rules visually and see precisely where they would have triggered on historical price data before you ever risk capital.
Bear Market vs. Bull Market: Key Differences
A bull market is the mirror image: a sustained rise of roughly 20% or more from a recent low, driven by optimism, expanding earnings expectations, and rising risk appetite. Together, bull and bear markets form the two dominant market cycle phases, with shorter transitional periods (often called consolidation or distribution phases) in between.
The key differences go beyond direction:
- Sentiment shift — bull markets are driven by confidence and greed; bear markets by fear and capital preservation.
- Volume and volatility patterns — bear markets typically show sharper, faster drawdowns punctuated by violent short-term rallies, while bull markets tend to grind upward with lower realized volatility.
- Behavioral asymmetry — losses in a bear market feel more urgent than equivalent gains in a bull market, which is why systematic rules matter more, not less, when sentiment turns negative.
Understanding this cycle isn't academic — it's the basis for deciding which strategy logic (trend-following, mean-reversion, defensive hedging) even makes sense to test for the environment you're in.
What Causes a Bear Market?
Bear markets rarely have one cause; they usually emerge from a combination of macro pressure and a shift in expectations. Common drivers include:
- Interest rates — central banks raising rates to control inflation increases borrowing costs and reduces the present value of future earnings, pressuring equity and crypto valuations alike.
- Earnings decline — when corporate profits shrink or guidance weakens, markets reprice growth assumptions downward.
- Economic slowdown — contracting GDP, rising unemployment, or weakening consumer spending erode confidence.
- Macro shocks — geopolitical conflict, pandemics, credit crises, or liquidity crunches can trigger a bear market abruptly rather than gradually.
It's worth separating recession vs. bear market explicitly: a recession is a measurable economic contraction (typically defined by shrinking GDP over consecutive quarters), while a bear market is a price phenomenon in financial markets. Markets often move ahead of the economy — bear markets frequently begin before a recession is officially confirmed, and sometimes occur without one at all, driven purely by sentiment and valuation resets.
Historical Examples of Bear Markets
Textbook definitions become useful only when you see them play out. Four episodes illustrate the pattern:
- Dot-com crash (2000–2002) — speculative internet valuations collapsed as earnings failed to justify prices, wiping out roughly 78% of the Nasdaq over two and a half years.
- 2008 financial crisis — a credit and housing collapse triggered a global bear market, with major indices losing 50%+ peak-to-trough over about 17 months.
- 2020 COVID crash — one of the fastest bear markets on record, with a roughly 34% S&P 500 decline in five weeks, followed by an unusually sharp recovery.
- 2022 bear market — driven by aggressive interest rate hikes and inflation, both equities and crypto assets fell in tandem, with major cryptocurrencies losing well over 60% from their late-2021 highs.
Crypto adds a structural wrinkle here: bitcoin's cycles from bull-market top to bear-market low have historically repeated on roughly four-year intervals since 2011, meaning a full crypto cycle spans closer to four years than the 12–18 months typical of equity bear/bull rotations. That's a meaningful difference if you're building rules meant to hold up across both asset classes.
How Long Do Bear Markets Last — and What Is a Bear Market Rally?
Duration varies widely — from the five-week 2020 shock to the multi-year dot-com decline — but most equity bear markets historically run somewhere between 9 and 18 months before establishing a durable bottom. Crypto bear markets, tied to that longer four-year cycle, have tended to stretch longer.
Inside nearly every bear market sits at least one bear market rally: a sharp, often 10–20% bounce that looks like a recovery but fails to hold, dragging prices to new lows afterward. These false recoveries are dangerous precisely because they coincide with renewed volatility spikes and a temporary return of optimism — exactly the moment undisciplined traders re-enter, only to be caught in the next leg down. Recognizing a bear market rally requires comparing the bounce against prior structure and volume, not just reacting to green candles.
How to Invest or Trade During a Bear Market
Traditional Approaches: Dollar-Cost Averaging, Shorting, and Hedging
Three tactics dominate conventional bear market advice. Dollar-cost averaging (DCA) means investing a fixed amount at regular intervals regardless of price, smoothing out entry points over a downturn — note this is distinct from an averaging-into-a-position approach that adds at progressively lower prices; a true DCA process buys or sells on a fixed schedule rather than reacting to price levels. Short selling involves borrowing and selling an asset to profit from a further decline, betting against the market rather than with it. Hedging strategies — using options, inverse positions, or uncorrelated assets — aim to offset losses in a core portfolio without fully exiting it. Each has a place, but applied manually and emotionally, all three are vulnerable to the same problem: inconsistent execution under stress.
Building a Rules-Based Bear-Market Strategy Without Code
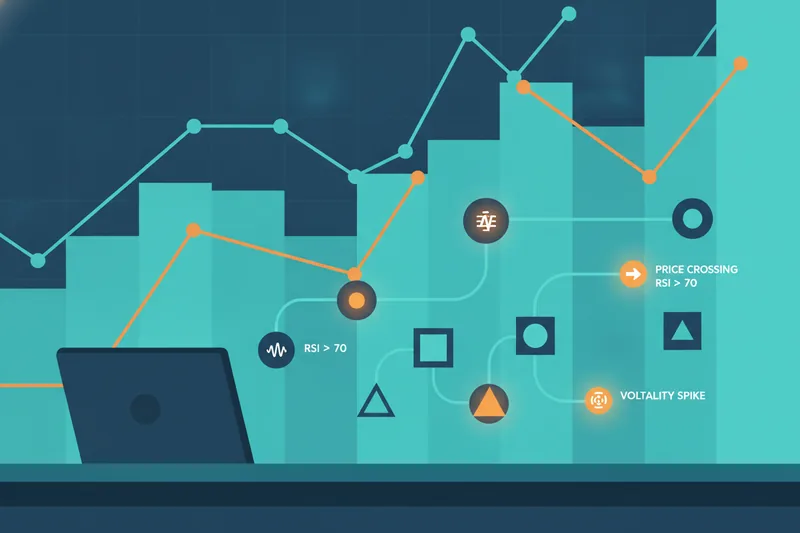
The alternative is to convert these tactics into explicit, testable logic instead of judgment calls made in real time. A no-code strategy builder lets you define conditions — a price crossing below a moving average, an RSI reading confirming oversold pressure, a volatility spike beyond a set threshold — and connect them into a deal map: a visual sequence covering entry, any averaging orders, exit targets, and a stop-loss that caps downside automatically. In Quberas, this deal map is built by dragging and connecting conditions rather than writing code, and a visual debugger highlights the exact chart zones where each rule would trigger, so you can see whether your bear-market logic is actually catching the moves you intend — or firing on noise. This is where the earlier internal reference to tuning thresholds to avoid false signals becomes directly practical: bear market volatility spikes are precisely the conditions that generate false triggers if thresholds are set too loosely.
Backtesting Your Strategy Against Past Bear Markets (2008, 2020, 2022)
Before any rules-based bear-market plan touches real capital, it needs to be run against historical data. Backtesting applies your strategy's logic to past price data to see how it would have performed — and it's generally treated as one of two required stages, alongside forward testing on live but unfunded conditions, before a strategy is considered ready for real money. Running the same deal map against 2008, 2020, and 2022 data reveals very different things: a stop-loss threshold that held up during the fast 2020 crash might get whipsawed repeatedly during the grinding 2022 decline. For a full walkthrough, see how to backtest a trading strategy step by step. It's also worth sizing risk deliberately rather than by feel — one commonly cited framework caps risk at 3% per trade and 5% across all open positions simultaneously, which is the kind of constraint that's easy to encode into a deal map's stop-loss logic and much harder to enforce manually when a position is moving against you.
Is It a Good Idea to Buy During a Bear Market?
There's no universal answer, and generic optimism about "buying the dip" ignores the bear market rally trap described earlier — a rebound that reverses can punish exactly the buyers who stepped in too early. The more useful question is whether your entry rule has historical evidence behind it. Backtesting bear markets specifically — rather than the market broadly — shows whether a given dip-buying rule (say, entering after a defined percentage decline plus an oversold indicator reading) actually recovered profitably across 2008, 2020, and 2022, or only worked in one of those episodes by luck. Risk management still governs the outcome regardless of the entry: a rule without a stop-loss or position-sizing constraint can turn a reasonable thesis into an outsized loss if the decline extends further than the historical sample suggested.
Are We in a Bear Market Right Now? How to Monitor and Prepare Systematically
Rather than guessing, monitor the same conditions that define a bear market in the first place: track the decline threshold against recent highs, watch for sustained volatility increases relative to the prior trend, and follow sentiment indicators (such as extreme fear/greed readings or breadth measures showing most assets declining together). None of this requires manual checking — the same visual conditions used in a deal map can be set as standing alerts, so a 20% drawdown, a volatility spike, or a sentiment threshold notifies you the moment it triggers rather than after the fact. That shifts bear-market preparation from a forecasting exercise into an ongoing, systematic check.
Waiting out a bear market is a choice, not a necessity — and it's rarely the choice that history rewards. Build and backtest a rules-based response with Quberas' no-code visual strategy builder, and see exactly how your deal map would have performed through 2008, 2020, and 2022 before a single dollar of real capital is on the line.