Crypto Market Cap Explained: Trading Signals
Crypto market cap tells you the total dollar value the market currently assigns to a coin, calculated as circulating supply (the coins actually in public hands) multiplied by the current price. It's the number that lets you compare Bitcoin to a small-cap altcoin on equal footing, and — more importantly for a trader — it's a signal you can turn into an actual rule: when dominance shifts, when a total crypto market cap rises or contracts, or when a coin's ranking changes, that's information you can encode into entry, exit, and risk logic rather than just glance at on a dashboard.
What Is Crypto Market Cap? (Definition and Formula)
Market capitalization is the standard way to size any tradable asset, and crypto borrowed it directly from equities. It answers one question: if every circulating coin were sold at the current price, what would the total be worth?
The market cap formula: circulating supply × price
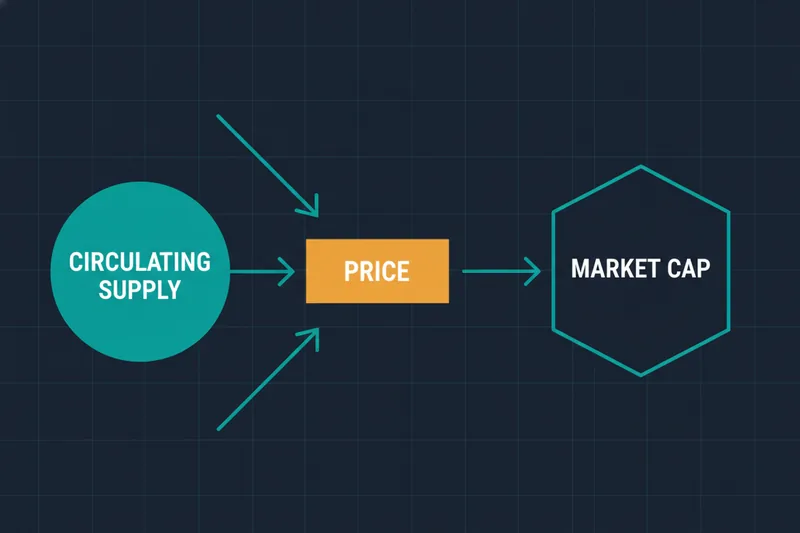
The formula is simple:
Market cap = circulating supply × current price
If a coin has 19.8 million coins in circulating supply and trades at $60,000, its market cap is roughly $1.19 trillion. Add up every coin's market cap and you get the total crypto market cap — the figure quoted as "the crypto market is worth $X trillion" in headlines. That aggregate number moves for two reasons only: prices moving across the board, or the circulating supply of assets changing (new coins minted, coins burned, new assets added to the count).
Why market cap is used instead of price alone
Price alone tells you almost nothing about size. A coin priced at $0.0001 can have a market cap in the billions if enough units exist; a coin priced at $30,000 can be tiny if only a few thousand units are in circulation. Traders who build automated logic run into this constantly — a "price target" rule ignores how much of the asset actually exists, while a market-cap-based rule reflects real market weight. This is exactly the kind of distinction that gets lost once you're several conditions deep into a strategy, which is why Quberas puts every condition on the chart visually rather than burying it in a parameter list — you can see whether a rule is actually reacting to size, not just price, before you ever risk capital on it.
Market Cap vs. Price vs. Fully Diluted Valuation (FDV)
These three numbers get conflated constantly, and mixing them up leads to real trading mistakes.
Why a low price doesn't mean a low market cap
A coin trading at a fraction of a cent isn't automatically "cheap" in market-cap terms — it depends entirely on circulating supply vs. total supply. Total supply is every coin that exists or is scheduled to exist right now, including tokens not yet released to the public (locked in team allocations, staking rewards, or vesting schedules). Two coins can trade at the same price and sit at wildly different market caps simply because one has 100 million coins circulating and the other has 100 billion.
When FDV signals hidden future dilution risk
Fully diluted valuation (FDV) is what the market cap would be if every coin that will ever exist — the maximum supply, not just what's circulating today — were already in circulation and priced at the current rate. A coin with a market cap of $200 million but an FDV of $4 billion has a huge gap between what's trading now and what's still locked up. As those tokens unlock and enter circulating supply, that supply increase can pressure price downward even if demand stays flat. A wide market cap-to-FDV gap is a dilution risk worth flagging before you build any medium-to-long-hold logic around a token.
Market Cap Rankings and Bitcoin Dominance Explained
Once you can calculate and compare market cap, the next layer is how the whole market is organized around it.
How rankings are ordered and updated
Market cap rankings simply sort every tracked asset from largest to smallest market cap, recalculated continuously as prices and supply move. Rank changes matter more than they look — a coin dropping from #8 to #15 is often a leading indicator of capital rotation before its price chart shows anything dramatic.
What Bitcoin dominance percentage tells you about the market
Bitcoin dominance is Bitcoin's market cap expressed as a percentage of the total crypto market cap. When dominance rises, Bitcoin is capturing a larger share of total market value relative to everything else — either because Bitcoin is outperforming, or because altcoins are shrinking faster. When dominance falls, capital is proportionally favoring altcoins. It's a ratio, not a price, which is exactly why it functions as a regime indicator rather than a trade signal by itself.
Top Cryptocurrencies by Market Cap Today
Rankings shift, but the mechanics of reading them stay constant.
Reading a market cap chart alongside 24h volume
A market cap chart/history shows how total valuation trended over time, but it needs to be read next to trading volume 24h — the dollar amount actually traded in the last day. A rising market cap on thin 24h volume suggests the move is fragile and could reverse quickly on light selling; a rising market cap backed by strong volume suggests real participation behind the trend.
Bitcoin vs. Ethereum: comparing the two largest market caps
Bitcoin vs Ethereum market cap comparisons are the clearest proxy for the market's broader risk appetite. Bitcoin is the larger, more liquid asset and tends to be treated as the market's base layer; Ethereum's market cap moving up relative to Bitcoin's is often read as capital getting comfortable taking on more risk further out the curve. Watching the ratio between the two — not just each coin's standalone chart — is more informative than either number in isolation.
Altcoin Season and Market Cap Rotation
This is where market cap stops being a reference number and starts being tradeable.
How falling dominance can signal altcoin season
Altcoin season describes a stretch where altcoins as a group outperform Bitcoin, typically coinciding with falling Bitcoin dominance — capital is rotating out of Bitcoin's market cap and into smaller assets. This is the practical version of large-cap vs small-cap rotation: money moves down the market cap ladder in search of higher returns once large-cap assets have already run.
Risks of chasing rotation blindly
Rotation is real, but it's not a switch that flips cleanly. Dominance can dip briefly without a genuine altcoin season developing, and small-cap assets carry far thinner liquidity, meaning entries and exits are more prone to slippage. Treating every dominance dip as a rotation signal, without confirming it against price action and volume, is a common way traders get caught holding illiquid positions into a reversal.
Why Market Cap Matters for Building and Backtesting a Trading Strategy
This is the part live dashboards don't help with: turning a market cap observation into a rule your strategy actually executes on.
Encoding dominance shifts as a strategy condition
A dominance-based rotation view — for example, reducing altcoin exposure as Bitcoin dominance climbs above a defined threshold, or increasing it as dominance falls — is really just a conditional statement: if dominance crosses a level, then adjust entries or exits accordingly. In Quberas, that condition sits directly on the deal map, the visual layout where entry, averaging, exit, and stop-loss logic connect stage by stage. Instead of a dominance shift living only in your head or a spreadsheet, it becomes a visible node in the strategy that you can trace on the chart alongside price and volume conditions.
Backtesting a rotation strategy before going live
Before committing capital to a dominance-driven rotation rule, it needs to be run against history. Backtesting — checking how a rule set would have performed against past market data — is one required step, and forward testing on live but unfunded conditions is the other; a strategy generally isn't considered ready for real capital until it's passed both. Quberas lets you backtest a strategy across different market cap regimes — a large-cap-led stretch versus an altcoin-led stretch — so you can see whether your rotation logic held up in both, and use the visual debugger to check whether a rule was close to triggering or genuinely fired, before adding risk controls like position sizing or cooldowns at the trade-map level. No-code strategy builders like this sit in their own category of automated trading tools, distinct from full coding environments or pre-built bot marketplaces, precisely because the logic stays visible and editable rather than buried in parameters.
FAQs About Crypto Market Cap
Does market cap predict future price? No. Market cap tells you current size and relative weight, not direction. It's useful as context for a rule — for example, gauging liquidity or rotation risk — not as a standalone predictor of where price goes next.
Why does market cap drop without a price crash? Market cap can fall if circulating supply decreases (coins burned or removed from circulating figures) even while price is flat, or it can fall gradually across many assets in small increments that don't look like a "crash" on any single coin's chart but add up across the total crypto market cap.
Is market cap the same as trading volume? No. Market cap measures total valuation at a point in time; trading volume 24h measures how much value actually changed hands in the last day. A coin can have a large market cap and comparatively low daily volume, which is itself a useful signal about liquidity risk.
Market cap, dominance, and rotation are only useful once they're rules, not observations. See how you'd translate a market-cap-driven view — like rotating out of altcoins as Bitcoin dominance rises — into an actual rule set: build and backtest it visually with Quberas.