TradingView Strategy: How It Works & a No-Code Alternative
A TradingView strategy is a script-based rule set that tells the platform when to enter and exit trades — and it comes with a built-in backtester that simulates those rules against historical price data. If you've been exploring TradingView to automate or test a strategy idea, you've probably already hit the wall: building or customizing strategies requires writing Pine Script, TradingView's proprietary coding language. This guide explains exactly how TradingView strategies work, what the backtest numbers actually mean, and why many non-coders are switching to visual no-code builders to get the same logic without writing a single line of code.
What Is a TradingView Strategy?
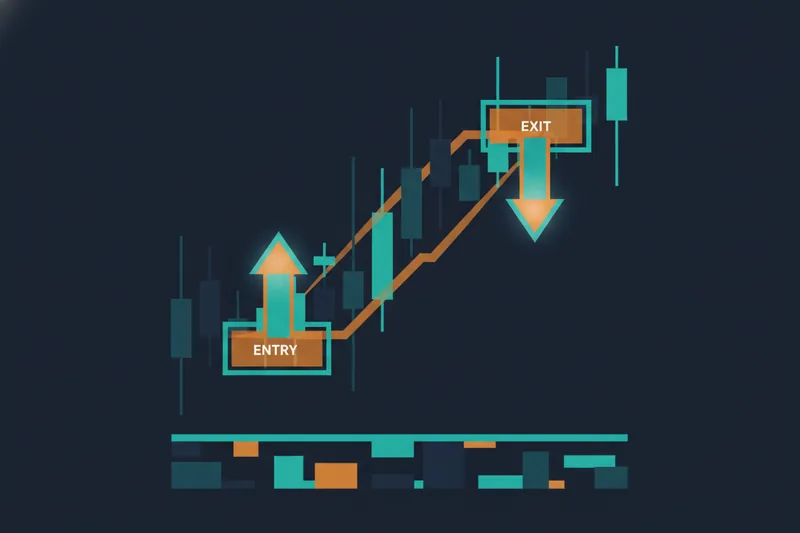
A TradingView strategy is a program — written in Pine Script — that defines a complete set of trading rules: when to buy, when to sell, how to size positions, and where to place stops. When you apply a strategy to a chart, TradingView executes those rules bar-by-bar against historical data and plots the resulting trade entries and exits directly on the chart.
Strategies vs. Indicators: What's the Difference?
TradingView distinguishes between two script types: studies (commonly called indicators) and strategies. An indicator calculates and plots data — a moving average line, an RSI oscillator, a volume histogram. It tells you what the market is doing, but it doesn't place trades.
A strategy goes further. It uses the same indicator logic but wraps it in order commands (strategy.entry(), strategy.exit(), strategy.close()) that simulate actual trade execution. The moment you apply a strategy script, the strategy tester panel appears at the bottom of the screen — that panel is what separates a strategy from a study. Without it, you're looking at an indicator.
How Entry and Exit Conditions Define a Strategy's Logic
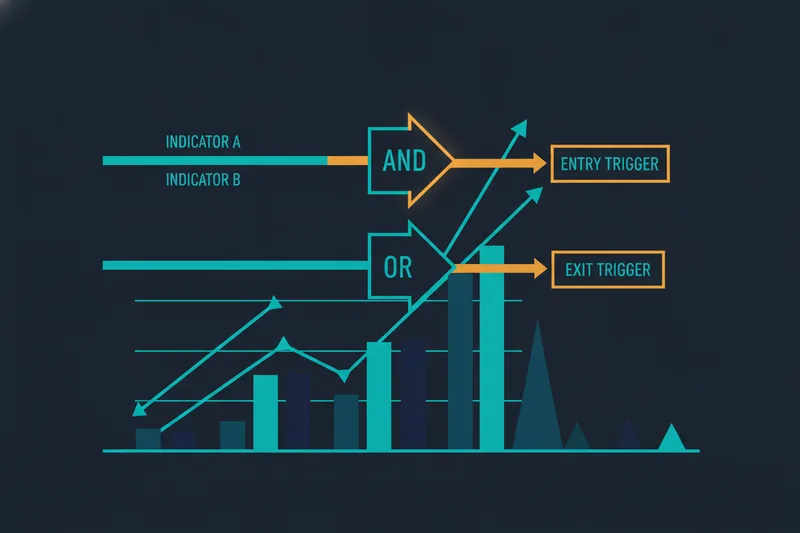
Every TradingView strategy is built from entry and exit conditions: logical rules that evaluate to true or false on each bar. A simple example: "Enter long when the 9-period EMA crosses above the 21-period EMA, and close the position when RSI exceeds 70." Those two conditions — one for entry, one for exit — are the entire logic skeleton. More sophisticated strategies stack multiple conditions using AND/OR logic, add stop-loss and take-profit levels, and filter by volume or time of day. The conditions are the strategy; everything else is execution detail.
How TradingView Strategy Backtesting Works
Backtesting is the process of running a strategy's rules against historical price data to see how it would have performed. TradingView's built-in backtester does this automatically when a strategy script is applied to a chart.
Setting Up the Strategy Tester: Key Inputs to Get Right
Open the strategy tester by applying any strategy script — the panel appears at the bottom automatically. Before you trust any results, check these inputs in the strategy's settings:
- Initial capital — the simulated account size. A strategy that doubles a $1,000 account looks very different from one that adds 5% to a $100,000 account.
- Position sizing — fixed contracts, percentage of equity, or fixed dollar amount. This dramatically affects drawdown figures.
- Commission and slippage — check the default values in your strategy settings and adjust them to reflect your actual exchange fees and realistic fill conditions. Running a backtest with fees set lower than what you'll actually pay will make results look better than they are.
- Bar magnifier — on lower timeframes, TradingView's backtester may use bar-level OHLC data rather than intrabar resolution. The bar magnifier setting is designed to improve fill simulation accuracy within each candle on short timeframes, though its availability and behavior can depend on your subscription tier and data feed.
Why Backtest Results Can Be Misleading (and How to Sanity-Check Them)
Two problems kill more backtest results than anything else:
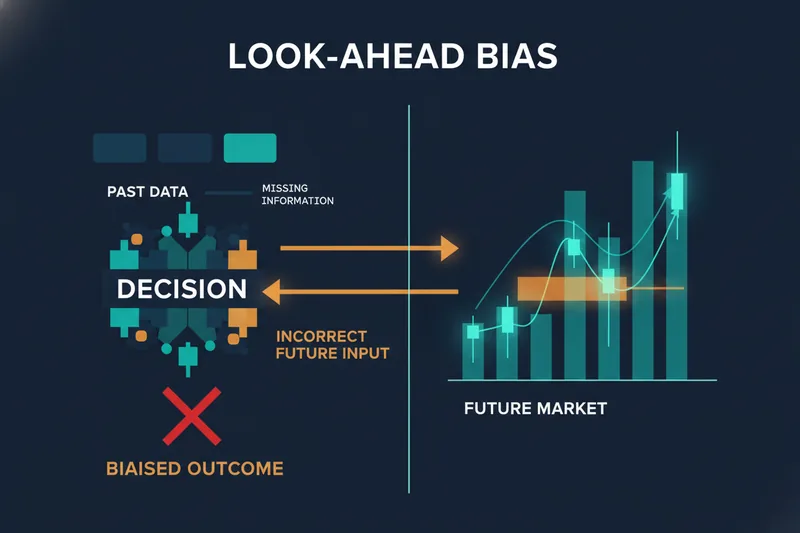
Look-ahead bias occurs when a strategy accidentally uses future data to make a past decision — a common Pine Script bug where a calculation references a value that wouldn't have been available at the time the bar closed. Results look extraordinary; live performance collapses.
Overfitting (also called curve-fitting) happens when a strategy's parameters are tuned so precisely to historical data that the rules describe the past rather than a repeatable edge. A strategy with a 94% win rate but only a handful of trades is almost certainly overfit. Always check the trade count — too few trades means the results may not reflect a statistically meaningful sample.
Reading the TradingView Strategy Report
The strategy report tab in the strategy tester is the output of every backtest. Here's how to read it without being misled.
The Metrics That Actually Matter
- Net profit — total gain or loss over the test period, expressed in currency and percentage. Useful only in context of drawdown.
- Percent profitable — the percentage of trades that closed as winners. A high win rate with tiny wins and large losses is a losing strategy.
- Profit factor — a ratio of gross profit to gross loss. A profit factor above 1.0 means the strategy made money overall; higher values suggest a stronger edge, though what counts as "good" depends on the strategy type, trade frequency, and market conditions.
- Max drawdown — the largest peak-to-trough equity decline during the test period. This is your real risk number. A strategy with 80% net profit but 60% max drawdown is not tradeable for most people.
- Number of trades and average trade duration — a low trade count means results may not be statistically meaningful. Average duration tells you whether the strategy is a scalper or a swing system.
- Sharpe ratio — when surfaced, this measures return relative to volatility. Higher is generally better, but what constitutes a strong Sharpe ratio varies by asset class, timeframe, and how the ratio is calculated. Some strategy scripts calculate and display it as part of their output.
Red Flags in a Strategy Report
A robust strategy shows consistent performance across different market conditions — not just one trending bull run. Red flags include: all profits concentrated in a single period, a very high win rate with very few trades, max drawdown that exceeds what you could psychologically or financially sustain, and profit factor that drops sharply when you add realistic commission and slippage. If the strategy only works with zero fees, it doesn't work.
Common TradingView Strategy Types: Price Action, Indicators, and Volume
Most strategies on TradingView fall into a few recognizable categories. Each can be expressed as a set of entry and exit conditions — which matters when you're thinking about building your own.
Indicator-Based Strategies: Moving Averages, RSI, and MACD
The most common category. A moving average crossover strategy generates signals based on the relationship between a faster and a slower moving average — for example, entering when a short-period average crosses above a longer-period one and exiting on the reverse. RSI (Relative Strength Index) strategies typically buy when the indicator signals oversold conditions and sell when it signals overbought. MACD — a momentum indicator derived from moving average relationships — generates signals on histogram crossovers or signal-line crosses. These are well-understood, easy to define as conditions, and widely tested — which also means they're rarely edge-generating on their own without additional filters.
Price action strategies — support and resistance levels, breakout entries, candlestick patterns like engulfing bars — don't rely on indicators but instead define conditions based on price structure. They're harder to code precisely in Pine Script because "support level" requires subjective definition.
VWAP and Volume Strategies
VWAP (Volume-Weighted Average Price) is the average price of an asset weighted by volume over a session. It's a widely referenced benchmark in intraday trading, particularly in equities and crypto. A common approach: enter long when price crosses above VWAP with above-average volume, exit when price returns to VWAP. Volume confirmation filters reduce false signals in breakout strategies.
Smart Money Concepts (SMC) Strategies
Smart Money Concepts (SMC) is a framework that attempts to model institutional order flow by identifying order blocks (price zones where large orders were placed), liquidity sweeps (moves that trigger retail stop-losses before reversing), and market structure shifts. SMC strategies are popular in crypto and forex communities. They're conceptually rich but notoriously difficult to code precisely — defining an order block programmatically in Pine Script requires careful logic that most retail traders can't write without significant experience.
Best TradingView Strategies from the Community Scripts Library
TradingView's community scripts library contains thousands of published strategies — some free and open-source, some protected (code hidden). You can browse by asset class, timeframe, or keyword, apply any script to your chart in one click, and immediately see backtest results in the strategy tester.
How to Find and Apply a Community Strategy Script
In TradingView, open the Indicators panel, switch to the "Community Scripts" tab, and filter by "Strategies." Apply a script to your chart and the strategy tester populates automatically. The TradingView Strategy Optimizer lets you test a range of input values — for example, running the backtest across multiple combinations of indicator lengths — to understand how sensitive results are to parameter choices. It's a useful tool for parameter sensitivity testing, though it also makes overfitting dangerously easy if you simply pick the highest-performing parameter set and call it done.
The Hidden Problem with Ready-Made Scripts
Open-source scripts let you read and modify the Pine Script code. Protected scripts don't — you can see the signals on the chart but have no visibility into the underlying rules. This is a significant risk: you're trading a black box. You don't know what conditions trigger entries, whether the logic has look-ahead bias, or how the strategy behaves in market conditions not represented in the backtest window.
Even with open-source scripts, modifying them requires Pine Script knowledge. Want to add a volume filter, change the exit logic, or combine two strategies? You're editing code. That's the real limitation the community library doesn't advertise.
The Pine Script Barrier: What TradingView Strategies Require from Non-Coders
Pine Script is TradingView's proprietary scripting language. Every strategy on the platform — whether you write it yourself or find it in the community library — is Pine Script under the hood.
What Writing a Pine Script Strategy Actually Involves
To write even a basic strategy from scratch, you need to understand Pine Script's syntax, its series-based data model (every variable is a time series, not a single value), the strategy() function declaration, order functions, and how conditions are evaluated bar-by-bar. A moving average crossover strategy might take an experienced programmer an hour to write correctly. For someone with no coding background, the learning curve is measured in weeks — and that's before debugging.
Why You Can't See Which Rule Fired on the Chart
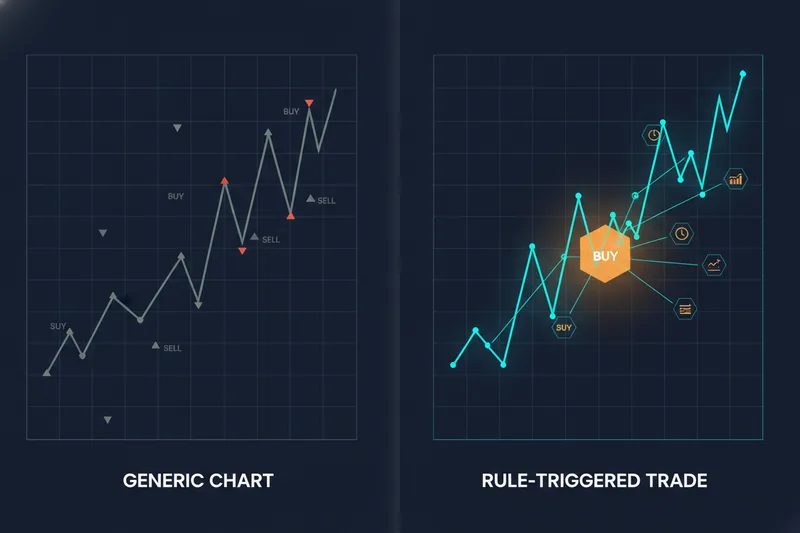
Here's a gap that most TradingView tutorials don't mention: even when a strategy is running and you can see entry/exit markers on the chart, TradingView's native UI doesn't show you which specific condition triggered a given trade. You see a buy arrow. You don't see "this fired because RSI crossed below 30 AND price was above VWAP." Debugging why a strategy entered or exited at a specific bar requires reading the code and reasoning through the logic manually — or adding custom plotshape() calls to visualize individual conditions, which itself requires more coding.
There's no drag-and-drop condition builder, no visual rule map, no way to click a trade and see the condition tree that produced it. The gap between "I have a strategy idea" and "I have a working, debuggable Pine Script strategy" is real, and for most retail traders, it's the reason strategy ideas stay ideas.
TradingView Strategy vs. No-Code Strategy Builders: A Direct Comparison
The Pine Script barrier is a solvable problem. No-code strategy builders replicate the logic of a TradingView strategy — entry conditions, exits, stop-losses, position sizing — through visual interfaces instead of code.
Building Entry and Exit Logic: Pine Script vs. Visual Condition Builder
In TradingView, you write conditions as code: ta.crossover(fastMA, slowMA) and rsi < 50. In Quberas, the same logic is built through a puzzle-style condition builder — you select indicators, define crossover or threshold conditions, and connect them with AND/OR logic visually. The deal map (Quberas's drag-and-drop strategy canvas) lets you configure entry conditions, averaging orders, take-profit exits, and stop-losses as connected visual blocks, not lines of code. Complex nested logic — the kind that would require careful Pine Script syntax — is handled through the condition builder's interface without writing anything.
Seeing Your Rules on the Chart: Visual Debugger vs. Signal Markers
This is where the workflows diverge most sharply. TradingView shows you where trades occurred. Quberas's visual debugger highlights the specific chart zones tied to each condition — so when a trade fires, you can see exactly which rule triggered it, directly on the chart. That's the transparency gap TradingView's native UI doesn't fill. For iteration — testing whether a condition is firing where you expect, spotting false signals, understanding why a trade didn't trigger — this visual feedback loop is significantly faster than reading Pine Script output.
Which Approach Is Right for You?
Pine Script is the right tool if you're a developer, want maximum flexibility, or need to implement highly custom logic that no visual builder supports. It's a genuinely powerful language with a large community.
For traders who have a clear strategy idea — specific entry conditions, defined exits, risk rules — but no programming background, the Pine Script path adds weeks of learning before you can test a single idea. A no-code builder like Quberas lets you define the same logic, backtest it, and see it on the chart without that prerequisite. It's not a replacement for Pine Script power users; it's an alternative for everyone the coding requirement was blocking.
Frequently Asked Questions
Can you make consistent money day trading with a strategy? Consistency comes from systematic rules and disciplined risk management — not from finding the "best" script. No strategy wins every trade. What separates profitable systematic traders is a defined edge, realistic position sizing, and the discipline to follow rules when individual trades lose. A strategy with a 45% win rate and a 2:1 reward-to-risk ratio can be profitable over time if executed consistently. Focus on the process, not the profit promise.
What is the TradingView Strategy Optimizer and how does it work? The Strategy Optimizer is a parameter-sweeping tool built into TradingView. You define a range of values for any input and TradingView runs the backtest across combinations, allowing you to compare results by performance metrics. It's useful for understanding parameter sensitivity — but it's also the fastest way to overfit a strategy if you simply pick the highest-performing parameter set and call it done.
Can I automate a TradingView strategy without Pine Script? Not natively within TradingView — execution requires either Pine Script or third-party webhook integrations that still depend on alert conditions defined in Pine Script. If you want to build and automate a strategy without writing code at all, you need a platform designed for that workflow from the ground up.
How accurate is TradingView backtesting? Accuracy depends on how carefully you configure the inputs. Setting commission and slippage to reflect real trading conditions is essential — a backtest run with unrealistic fee assumptions will overstate performance. Look-ahead bias in the script itself is often a bigger accuracy risk than the platform's mechanics, so always verify that your strategy doesn't reference future data. The bar magnifier setting can affect how fills are simulated on shorter timeframes, and its behavior may vary depending on your subscription and data feed.
What indicators work best in a trading strategy? There's no universal answer — indicator performance depends on the asset, timeframe, and market conditions at a given time. The more useful question is: does your chosen indicator define a condition you can state precisely, backtest honestly, and execute consistently? If yes, it's a candidate. If you're choosing indicators because they look good on a chart, that's not a strategy.
Ready to build your TradingView strategy idea without Pine Script? Try Quberas — define your entry and exit conditions visually, see exactly where your rules trigger on the chart, and backtest before you go live.