Cryptocurrency Swing Trading: Build & Test Strategy

Cryptocurrency swing trading means holding a position for several days to a few weeks to capture a single price swing, rather than closing trades within minutes (day trading) or holding for years regardless of volatility (HODLing). It sits between those two extremes: long enough to ride a real move, short enough to sidestep the multi-year drawdowns that come with buy-and-hold. The challenge isn't understanding that definition — most intermediate traders already do. It's turning "buy support, sell resistance" into a repeatable process with defined position sizes, tested entry rules, and exits you don't second-guess mid-trade.
What Is Cryptocurrency Swing Trading?
Swing trading is a medium-term style built around capturing one leg of a price move — a swing from a low to a high, or a high to a low — using technical setups rather than fundamentals or news flow. Positions typically stay open for 2 to 15 days, sometimes longer if a trend keeps extending, which puts it well past day trading's intraday window and well short of a multi-year hold.
The contrast with day trading is mostly about timeframe and monitoring load. Day traders, and especially scalpers, work on very short charts — strategies built around 1-minute to 15-minute candles, where trades are managed over seconds or minutes and outcomes hinge on execution speed and spread rather than the broader trend. Swing traders work on 4-hour, daily, or weekly charts instead, checking positions a few times a day rather than watching a screen constantly. Compared to HODLing, swing trading actively manages exposure — you're in cash or stablecoins between trades, not permanently exposed to drawdowns. That's also where the discipline problem shows up: knowing you should exit at a resistance level and actually doing it, consistently, across dozens of trades, is a different skill than reading a chart. That's the gap platforms like Quberas are built to close, by letting you define swing rules visually and see exactly where they would have fired before you commit real capital.
How Does Swing Trading Work?
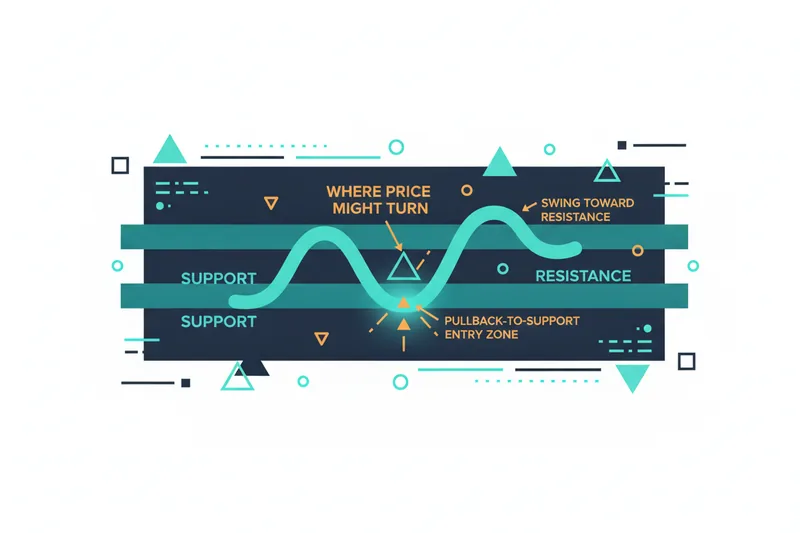
The mechanism behind swing trading is straightforward: markets move in waves, not straight lines, and each wave has a start and an end defined by support and resistance — price levels where buying or selling pressure has previously reversed the trend. Support is a floor where demand has stepped in before; resistance is a ceiling where selling has capped previous rallies. Swing traders use these levels, plus the direction of the broader trend, to time both entries and exits.
Trend identification comes first. If Bitcoin or Ethereum is making higher highs and higher lows on the daily chart, the swing trader looks for pullbacks toward support as entry opportunities within that uptrend, rather than trying to pick a bottom against it. If the trend is down, the logic flips — rallies into resistance become potential short or exit points, not buying opportunities. The entry and exit logic follows directly from this: you enter near a support/resistance boundary that aligns with the trend, and you exit either at the opposing boundary, at a predefined profit target, or when price action signals the swing is over. None of this requires predicting the market — it requires a consistent rule for where you act and where you don't.
Best Indicators & Strategies for Crypto Swing Trading
Support and resistance tell you where price might turn; indicators help confirm whether it's actually turning. Three tools do most of the work in crypto swing setups: RSI, MACD, and moving averages.
Using RSI to spot overbought/oversold zones
The Relative Strength Index (RSI) measures the speed and magnitude of recent price changes on a 0–100 scale. Readings above 70 typically flag an asset as overbought — a potential exit or short zone if you're already positioned — while readings below 30 flag oversold conditions, often watched as re-entry zones during an uptrend's pullback. RSI works best as a timing filter on top of a trend read, not as a standalone buy/sell signal, since an asset can stay overbought for a long stretch during a strong trend.
MACD and moving average crossovers for trend confirmation
MACD (Moving Average Convergence Divergence) tracks the relationship between two moving averages of price to show momentum shifts. When the MACD line crosses above its signal line, it suggests building upward momentum; a cross below suggests the opposite. Similarly, a shorter moving average crossing above a longer one (a "golden cross") is a classic trend-confirmation signal, while the reverse ("death cross") flags weakening momentum.
These tools split into two broader approaches. Trend-following strategies use moving average crossovers and MACD to ride an established direction, entering on pullbacks and exiting when momentum fades. Mean-reversion strategies lean on RSI extremes, betting that an overstretched move snaps back toward an average. Most swing traders combine both: trend tools to pick direction, RSI to time the entry within it.
Risk Management: Position Sizing and the 2% Rule
Indicators tell you when to act; position sizing determines whether one bad trade can hurt you. The most common baseline is the 2% rule: risk no more than 2% of total trading capital on any single trade, where "risk" means the distance between your entry and your stop-loss, multiplied by position size — not the full position value.
Concretely: on a $10,000 account, 2% is $200 of risk per trade. If your stop-loss sits 5% below your entry price, your position size should be roughly $4,000 (since 5% of $4,000 is $200), not the full account. This keeps a string of losing trades from compounding into account-threatening damage — ten straight 2% losses only costs about 18% of capital, not 20%, because each loss is calculated against a shrinking balance.
Some traders extend this into a 3-5-7 rule: cap risk on any single trade at 3%, cap total risk across all simultaneously open positions at 5%, and require a minimum 7% profit-to-loss ratio target before taking the trade at all. Whichever variant you use, the mechanics depend on two order types working together: a stop-loss, which automatically closes a losing position at a predefined price to cap downside, and a take-profit, which locks in gains at a target level without requiring you to watch the chart. Setting both before entering the trade — not after — is what separates rules-based risk management from hoping it works out.
Which Cryptocurrencies Are Best for Swing Trading?
Swing setups need two things a coin either has or doesn't: liquidity and volatility. Liquidity — how easily an asset can be bought or sold without moving its price — matters because thin order books cause slippage that erodes tight stop-losses and profit targets. High trading volume is the practical proxy for this: assets that trade heavily on major exchanges let you enter and exit near your intended price.
Volatility is the raw material of swing trading — without meaningful price swings, there's no move to capture. But volatility without liquidity is dangerous, since sharp moves in a thin market can gap straight through a stop-loss. In practice, this points swing traders toward large-cap and established mid-cap coins with consistent daily volume, rather than illiquid microcaps where a single large order can distort the chart. This isn't a recommendation of specific coins — it's a filter to apply before you build any strategy around one.
How to Backtest a Swing Trading Strategy Before Going Live
Backtesting means running your entry, exit, and risk rules against historical price data to see how the strategy would have performed, without risking capital. For crypto, this typically uses OHLCV data — open, high, low, close, and volume figures for each time period — though more advanced tests can incorporate order book data to model how orders would actually have filled, capturing slippage and depth that raw candle data misses.
Backtesting alone isn't the finish line, though. A strategy should clear both backtesting and forward testing — running it on live, unseen data in real time without committing full capital — before it's considered ready, since neither stage substitutes for the other. Backtesting confirms the logic worked historically; forward testing confirms it still holds up under current market conditions and execution realities.
When reviewing backtest results, look past raw profit. A Sharpe ratio — a measure of return relative to volatility — above 1.0 is generally considered acceptable, above 2.0 is strong, and above 3.0 is excellent. A strategy with a high win rate but a poor Sharpe ratio is often just taking on outsized risk to get there. Testing multiple variations of the same strategy — different RSI thresholds, different stop-loss distances — side by side is how you find which version actually holds up, rather than guessing which parameter "feels right."
Common Mistakes, Trading Psychology, and FAQs
Most swing trading losses trace back to psychology, not strategy. Overtrading — taking setups that don't fully meet your rules because you're impatient for action — erodes accounts faster than any single bad trade. Emotional exits, closing a position early out of fear or holding a loser too long hoping it recovers, undo the exact stop-loss and take-profit discipline covered above. The fix isn't willpower; it's removing the decision from the moment of the trade by defining rules in advance and following them mechanically.
Realistic profit expectations matter too. Consistent swing trading is generally about compounding modest, repeatable edges over many trades — not doubling an account in a month. Strategies that look spectacular in a short backtest window often haven't been tested across different market conditions.
How much capital do you need to start swing trading?
There's no fixed minimum, but position sizing math matters more than the starting number. If the 2% rule caps a $200 risk budget on a $10,000 account, a $500 account only allows $10 of risk per trade — workable, but it narrows which setups make sense given exchange fees and minimum order sizes. Smaller accounts need tighter discipline, not larger risk percentages.
Can you swing trade profitably without watching charts all day?
Yes — that's the structural advantage of swing trading over day trading. Because trades play out over days rather than minutes, checking charts once or twice daily, with stop-loss and take-profit orders already set, is standard practice rather than a compromise.
Tools to Automate, Visualize, and Debug Your Swing Trades
Once entry, exit, and risk rules are defined, the next problem is consistency — executing them the same way every time, without hesitation or manual error. This is where a no-code algorithmic trading platform replaces discretionary execution with rules that fire automatically.
Building entry, exit, and stop-loss logic without code
Quberas structures a strategy as a deal map — a visual, drag-and-drop layout of entry conditions, averaging orders, exits, and stop-losses connected as stages rather than buried in parameters or code. This differs from a simple DCA bot, which buys or sells at fixed intervals over a set schedule regardless of price; a deal map instead lets you define conditional averaging tied to price and indicator behavior, alongside the RSI, MACD, and moving-average crossover logic covered earlier, combined through a puzzle-style condition builder that supports nested logic across price, volume, and multiple indicators at once. Some platforms handle this kind of rule-based automation through code, such as Python scripts; Quberas is built specifically so the same logic is assembled visually instead.
Debugging why a trade triggered (or almost did)
A rule that looks correct on paper doesn't always behave as expected on a live chart. The visual debugger highlights the exact chart zones tied to each condition, showing not just when a rule triggered but how close it came to triggering when it didn't — the difference between a threshold that's slightly too tight and one that's genuinely broken. That's the direct answer to false signals from noisy indicators: instead of guessing whether your RSI threshold is too aggressive, you see the near-misses on the chart and adjust the number, not the whole strategy.
Launching or monetizing a strategy on the marketplace
Before committing capital, strategies can be run against historical OHLCV or more granular order-book-derived data to compare variations, matching the backtesting practice described above. Traders who'd rather skip building from scratch can select a ready-made strategy from the strategy marketplace, set their own risk parameters, and test it before going live. Traders who develop something that performs well can publish it publicly or share it via a private link, earning recurring payouts when others use it.
See exactly how your swing strategy would trigger on the chart — build, backtest, and launch it visually with Quberas, no coding required.