Trading Patterns Explained: Read, Test & Automate
What Are Trading Patterns?
Trading patterns are recurring price structures that form on a chart when buyers and sellers repeat the same behavior under similar conditions. They're the visible output of technical analysis — the practice of studying price and volume history to anticipate what price is likely to do next, rather than analyzing a company's fundamentals or a coin's underlying network activity. A pattern isn't a prediction engine; it's a compressed summary of how supply and demand have behaved at specific price levels in the past, expressed as a shape you can recognize on a chart.
At the core of every pattern sits support and resistance — the price levels where buying pressure has repeatedly stopped a decline (support) or selling pressure has repeatedly capped a rally (resistance). Patterns are really just the record of price interacting with these levels over time, drawn out as triangles, rectangles, or head-like shapes.
Why patterns repeat: the psychology behind price behavior
Patterns recur because market participants tend to make the same decisions when faced with the same visual information. A trader who bought near a prior high and watched price fall will often sell into a rally back to that same level, just to get out even — this is market psychology in action: fear, regret, and anchoring show up as buy and sell decisions clustered around specific prices. Because thousands of traders react the same way to the same chart shape, the resulting price behavior repeats often enough to be named and studied.
Patterns as visual shorthand for supply and demand
A pattern is really price action — the raw sequence of highs, lows, and closes — condensed into a shape that tells you, at a glance, whether demand or supply currently has the upper hand. A tightening range means the two sides are converging toward a decision point. A series of higher lows means demand is stepping in earlier each time. Reading a pattern is really reading a compressed history of that tug-of-war.
Types of Chart Patterns: Reversal vs Continuation
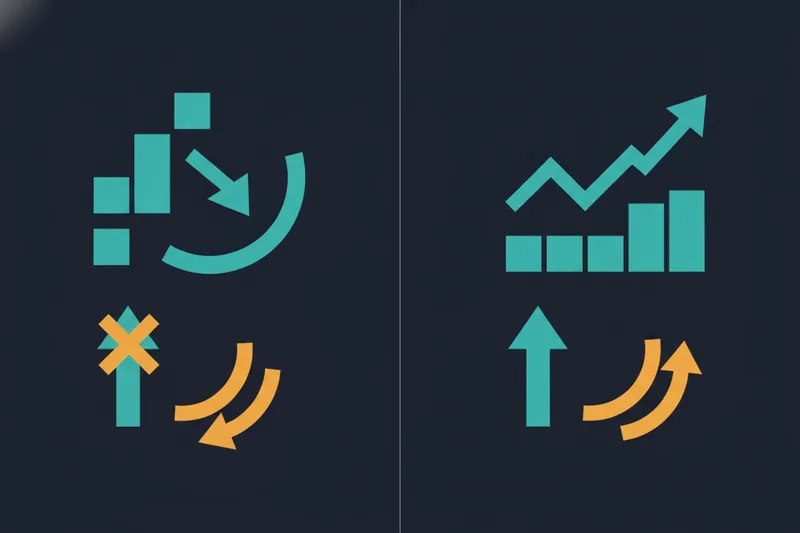
Every chart pattern falls into one of two camps, and understanding this split before memorizing individual shapes saves a lot of confusion later. This is the reversal vs continuation signals framework, and it governs how you're supposed to interpret every pattern in the next section.
Reversal patterns: when a trend is about to change
A reversal pattern signals that the prevailing trend direction is losing momentum and is likely to flip. These form after an extended move, when the group that's been driving price (buyers in an uptrend, sellers in a downtrend) starts running out of new participants willing to push further. Head and shoulders, double tops, and double bottoms are the classic examples — they typically appear at the end of a trend, not in the middle of one.
Continuation patterns: when a trend is likely to persist
A continuation pattern signals a pause, not a change. Price consolidates briefly — often on lower volume — before resuming in the same direction it was already moving. Flags, pennants, and (in most cases) triangles fall here. The key practical difference: trading a reversal pattern means betting against the current trend, while trading a continuation pattern means betting with it. Confusing the two is one of the most common reasons a pattern-based trade fails.
Candlestick Patterns vs Chart Patterns
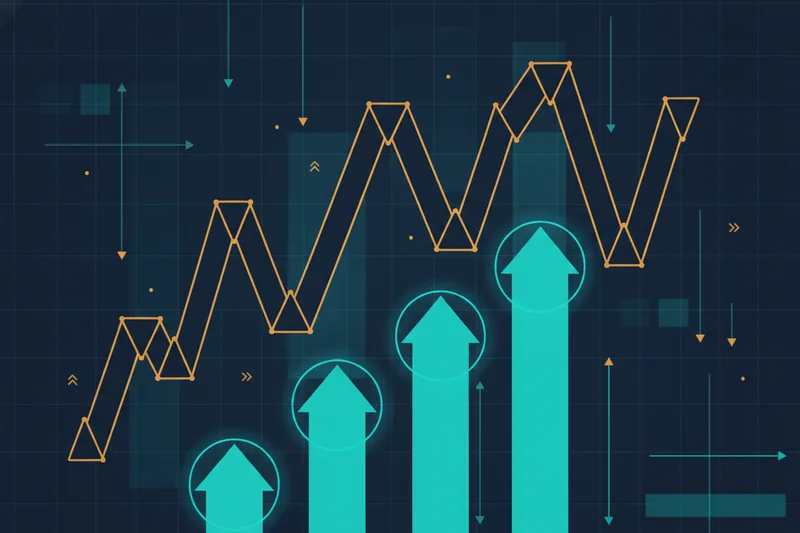
Traders often use "pattern" to describe two genuinely different things, and mixing them up leads to poor timing decisions.
What makes a candlestick pattern different
Candlestick patterns are formed by one, two, or three individual candles and are read on a much shorter timeframe scope — they describe an immediate shift in momentum, such as sellers rejecting a new high (a shooting star) or buyers overwhelming sellers within a single session (a bullish engulfing candle). Chart patterns, by contrast, form over dozens or hundreds of candles and describe a structural shift in the broader trend. A candlestick pattern is a sentence; a chart pattern is the paragraph it belongs to.
When to use each type together
The two work best combined rather than in isolation. A head and shoulders pattern might take weeks to form on a daily chart, but the actual break of its neckline is often confirmed by a strong bearish candlestick pattern on that same day — giving you both the structural context and the precise trigger. Relying on chart patterns alone can mean entering too early, before the structure actually resolves; relying on candlesticks alone can mean reacting to noise with no larger context behind it.
Most Common Chart Patterns Explained (with Examples)
With the reversal/continuation and chart/candlestick distinctions in place, here are the specific shapes worth knowing.
Head and shoulders
The head and shoulders pattern is a reversal pattern made of three peaks: a central peak (the head) higher than two surrounding peaks (the shoulders), connected by a "neckline" drawn across the lows between them. It typically marks the end of an uptrend. The inverse version — inverse head and shoulders — marks the end of a downtrend and looks like the pattern flipped upside down.
Ascending, descending, and symmetrical triangles
Triangle patterns form when price consolidates between two converging trendlines. An ascending triangle has a flat resistance line and a rising support line, and usually resolves upward — it's typically a continuation pattern in an uptrend. A descending triangle is the mirror image and usually resolves downward. A symmetrical triangle has both lines converging toward each other and is more neutral: it signals compression and an imminent breakout, but not reliably in which direction, which is exactly why the breakout itself — not the triangle shape — is what should trigger a trade.
Flags and pennants
Flag and pennant patterns are short continuation patterns that form after a sharp, fast move — the "flagpole." A flag consolidates in a small parallel channel; a pennant consolidates in a small symmetrical triangle. Both are usually brief, often lasting only a handful of candles, and both typically resolve in the same direction as the flagpole that preceded them.
Double tops and double bottoms
A double top and double bottom is a reversal pattern where price tests the same high (or low) twice, fails to break through, and reverses. The failure to make a new high or low on the second attempt is the tell — it shows the dominant side has run out of strength. A related, less symmetrical pattern is the cup and handle: a rounded consolidation (the cup) followed by a smaller pullback (the handle) before a continuation breakout — more common in slower-moving trends than in fast, volatile ones.
How to Trade Each Pattern: Entry, Exit, and Stop-Loss
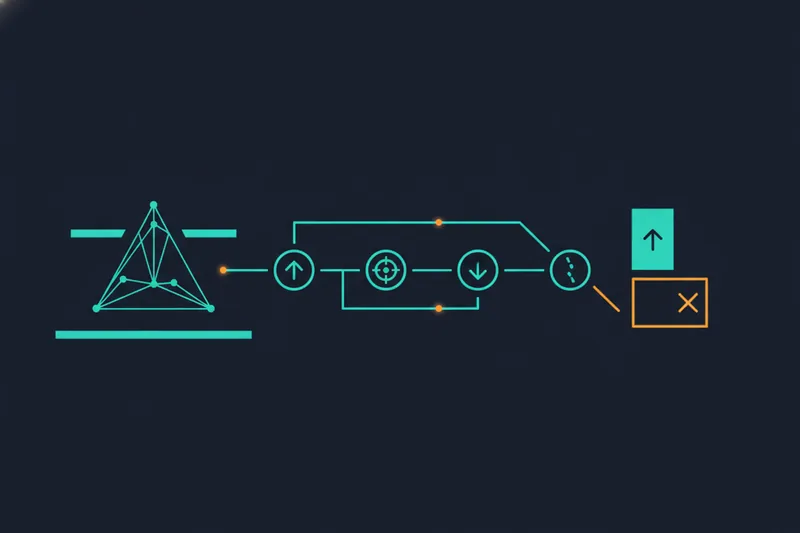
Recognizing a shape is only half the job. Every pattern needs to be converted into three concrete rules before it means anything to your account:
- Entry conditions — the specific price action that confirms the pattern is complete, not just forming. For a triangle, that's usually a close beyond the trendline, ideally with rising volume. For head and shoulders, it's a close below the neckline, not merely a touch of it.
- Exit rules — a target derived from the pattern's own geometry. A common approach: measure the pattern's height (e.g., head to neckline) and project that same distance from the breakout point. This gives you a defined, pattern-specific target instead of an arbitrary one.
- Stop-loss placement — set beyond the point that would invalidate the pattern, not just a fixed percentage away. For an ascending triangle, that's typically just below the rising support line; for a double top, just above the second peak.
This is where risk management and pattern trading actually meet: a pattern gives you a shape, but only a defined entry, target, and invalidation point turn it into a trade with a known risk-reward profile before you place it.
Do Trading Patterns Actually Work? Backtesting the Evidence
Patterns look convincing in hindsight because your eye naturally skips the failed ones. That selective attention is exactly why "I've seen this work before" is not evidence — it's a memory of the times it happened to work.
Why eyeballing a chart isn't proof
Scanning a chart for familiar shapes is inherently biased: you notice the triangle that broke out cleanly and forget the five that chopped sideways and stopped you out. Without a systematic count of every occurrence of a pattern and its outcome, "it works" is an impression, not a statistic.
What backtesting reveals that theory can't
Backtesting is the process of running a strategy's rules against historical data to see how they would have actually performed, trade by trade. For pattern-based rules, this means feeding in OHLCV data — open, high, low, close, and volume for each historical candle — and letting the rules mechanically identify every instance where the pattern's entry, exit, and stop-loss conditions were met.
What comes out the other side is a win rate: the percentage of trades that hit their target versus their stop, across every historical occurrence rather than the handful you happened to notice. A pattern with a 38% win rate can still be profitable if winners are large relative to losers, and a pattern with a 60% win rate can still lose money if losses run larger than gains — which is why win rate alone isn't the full picture. Before a strategy is trusted with real capital, it generally needs to clear both a backtest against history and a forward test under live but simulated conditions.
Backtesting also exposes false signals / noise — the near-misses where price almost completed a pattern's condition, then reversed. Theory doesn't show you how often a "breakout" was really just a wick that closed back inside the range. A backtest counts every one of those instances honestly, whether you'd have wanted to see them or not.
How to Automate Pattern-Based Strategies
Once a pattern's rules have been defined precisely enough to backtest, they're already close to precise enough to automate — the gap left is mechanical, not conceptual.
Turning a pattern into a rule instead of a guess
A no-code strategy builder lets you express a pattern's entry, target, and stop-loss as explicit conditions — a breakout above a trendline, a close beyond a neckline, a volume threshold — without writing code to detect them. In Quberas, this takes the shape of a deal map: a visual sequence covering the entry trigger, any averaging orders, the exit, and the stop-loss as connected stages, so the full lifecycle of a pattern-based trade is laid out rather than buried in parameters. It's worth noting that an averaging order that adds to a position at progressively better price levels is a different mechanism from a dollar-cost-averaging (DCA) bot, which buys or sells at fixed time intervals regardless of price — pattern-based averaging typically uses the former, reacting to price rather than the clock.
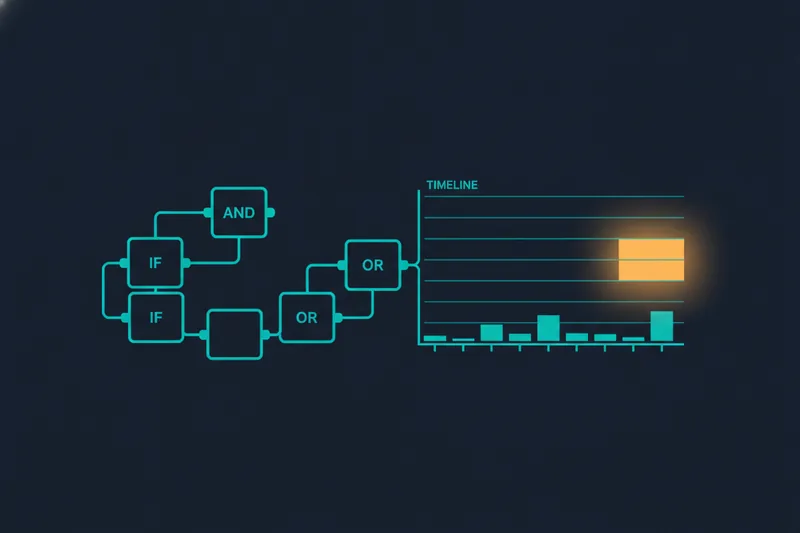
The condition builder is where the pattern's logic actually gets defined, using nested logic — for example: "price closes below the neckline AND volume is above its 20-period average AND the prior swing formed a lower high." Chaining conditions this way is what separates a rule from a rough eyeball check.
Tuning thresholds to reduce false triggers
Every pattern rule has a threshold buried in it — how far past the trendline counts as a real breakout, how much volume counts as "confirming." Set it too loose and you catch every twitch as a signal; set it too tight and you miss real moves waiting for perfect confirmation. This is also where broader risk thresholds belong: a rule like the 3-5-7 rule caps risk on any single trade at 3% of capital, caps total exposure across all open positions at 5%, and requires a minimum 7% profit-to-loss ratio before a setup is worth taking — a useful sanity check to layer on top of any pattern-based entry, pattern-specific or not.
Seeing exactly where a condition fires on the chart
The hardest part of tuning a pattern rule is knowing why it triggered when it did — or why it didn't trigger when you expected it to. Quberas's visual debugger highlights the exact chart zone tied to each condition, including cases where a condition came close to firing but didn't quite clear the threshold. That "almost vs. triggered" view is what lets you adjust a breakout threshold or a volume filter based on what actually happened on the chart, instead of guessing at new parameter values and rerunning a backtest blind.
Common Mistakes When Trading Patterns
Most pattern-trading losses trace back to a handful of repeatable errors:
- Trading the pattern in isolation. A textbook triangle against a strong opposing trend on a higher timeframe fails far more often than the same pattern aligned with it.
- Ignoring volume and context. A breakout on thin volume is far more likely to be false signals / noise than a genuine shift in supply and demand — volume is what separates a real move from a head-fake.
- Overfitting to a small sample. Tweaking a pattern's thresholds until a backtest shows a perfect win rate over 15 trades produces rules tuned to noise, not to a repeatable edge. Overfitting is easy to spot after the fact: performance that looked excellent in the backtest collapses the moment it meets new, unseen data.
- Confirmation bias. Once you've decided a head and shoulders is forming, it's tempting to interpret every subsequent candle as confirming it. Predefined, rule-based conditions checked mechanically remove this bias — the rule doesn't care what you want to see.
Frequently Asked Questions About Trading Patterns
What is the 3-5-7 rule in trading? It's a risk-management framework, not a pattern: cap risk on any single trade at 3% of capital, cap combined risk across all open positions at 5%, and only take trades offering at least a 7% profit-to-loss ratio. It pairs with any pattern strategy as a risk filter, not a replacement for entry logic.
What is the most reliable chart pattern? No single pattern is reliable in every market condition — reliability depends on context, timeframe, and confirmation from volume. What backtesting consistently shows is that a pattern's historical win rate on your specific market and timeframe matters far more than its general reputation, which is why validating it yourself beats trusting a general ranking.
Is pattern trading good for beginners? Patterns are a reasonable entry point into technical analysis because they're visual and easier to grasp than indicator math. The risk for beginners isn't the patterns themselves — it's trading them on instinct without backtesting the specific setup first, which is exactly the gap between "I think I see a pattern" and a rule that's actually been proven out on history.
Ready to see if a pattern really holds up? Build it as a visual, no-code strategy in Quberas and backtest it on historical data before risking a single trade.