How the Market Works: Trader's Guide | Quberas
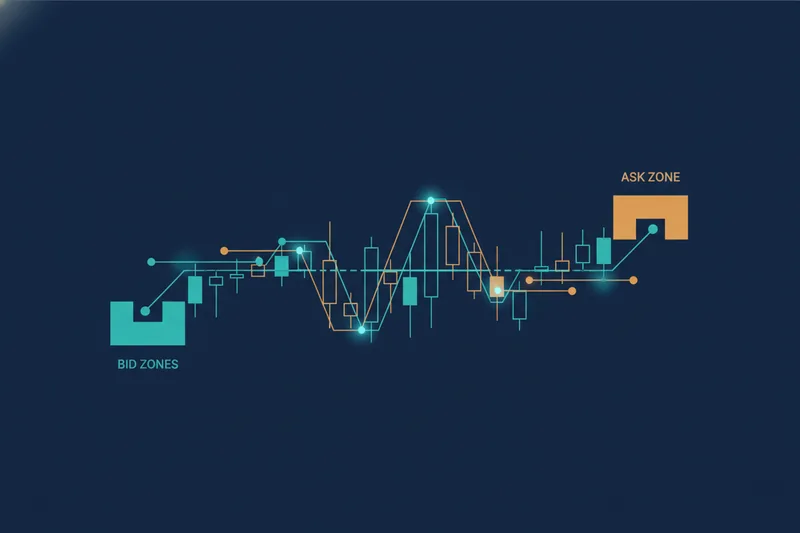
The stock market moves on a simple mechanic that gets buried under jargon: buyers and sellers post prices, and every trade that clears sets the next price everyone sees. Once you understand how that price actually forms — through orders, exchanges, and the balance of risk and reward — you stop reacting to charts and start recognizing patterns you can define as rules. That shift, from watching price to understanding it, is what this guide walks through, ending with how those same rules can be built visually into a tested trading strategy rather than judged in the moment.
What Is the Stock Market?
The stock market is the collection of exchanges and venues where investors buy and sell ownership stakes in publicly traded companies. It's not a single building or ticker tape — it's a networked system of matching buyers with sellers at agreed prices, continuously, during trading hours.
Shares as ownership stakes
A share represents a fractional ownership claim in a company (also called equity). Own one share of a company with a million shares outstanding, and you hold a proportional claim on its earnings and assets — no more, no less. Prices move because the market is constantly repricing what that claim is worth based on new information: earnings, guidance, macro data, or plain sentiment.
Where trading happens: exchanges vs. over-the-counter
Most shares trade on formal stock exchanges like the NYSE or NASDAQ, which enforce listing standards and centralize order matching so prices are transparent and trades settle reliably. Some smaller or less liquid securities trade over-the-counter (OTC), directly between parties or through dealer networks, with less standardization and typically wider spreads. That gap between watching a price tick and understanding why it moved is exactly where tools like Quberas fit — turning the logic a trader would otherwise judge by feel into visible, defined rules on the chart.
How Stock Prices Move: Supply, Demand, and Order Flow
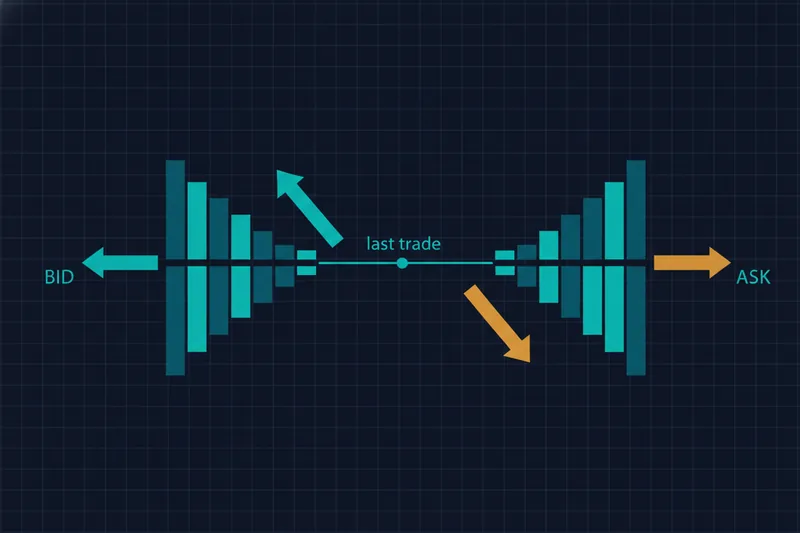
Prices aren't set by a company or an exchange — they're set by supply and demand expressed through orders. Every price you see is the last point where a buyer and seller agreed.
Bid, ask, and the spread
At any moment, the market shows a bid (the highest price a buyer is currently willing to pay) and an ask (the lowest price a seller will accept). The gap between them is the spread. When you place a market order, you accept whatever the current bid or ask is to get filled immediately. A limit order instead sets your own price and waits — it only fills if the market reaches it, giving you price control at the cost of certainty of execution.
Why prices tick up and down
When buy orders outpace sell orders at a given price, that price gets consumed and the next trade happens higher — demand exceeding supply pushes the price up. The reverse pulls it down. This is why price action often looks noisy on short timeframes: it's a live tally of competing orders, not a smooth signal.
Key Players: Exchanges, Brokers, and Market Indices
The mechanics above don't happen in a vacuum — they run through specific infrastructure and get summarized for anyone trying to gauge the market as a whole.
What brokers and trading platforms actually do
A broker is the intermediary that routes your order to an exchange (or matches it internally) and holds your account. A trading platform is the interface — web, desktop, or mobile — where you place those orders, watch charts, and manage positions. Exchanges like the NYSE and NASDAQ don't deal with retail traders directly; brokers are the access layer in between.
What a market index (like the S&P 500) tells you
A market index — the S&P 500, the Nasdaq Composite, the Dow — tracks a basket of stocks to represent the health of a market segment in one number. It's a reference point: when people say "the market was up today," they usually mean an index moved, not that every stock did.
How Companies Raise Capital Through IPOs
Shares have to originate somewhere before they trade on an exchange. An IPO (Initial Public Offering) is the process by which a private company sells shares to the public for the first time, raising capital in exchange for giving up a slice of ownership. Once listed, those shares enter the same supply-and-demand order flow described above — the IPO price is just the starting point; the market decides everything after.
Understanding Risk, Return, and Diversification
Every position carries a trade-off: the potential for return comes paired with risk — the chance the trade moves against you. No strategy escapes that relationship; the goal is managing it deliberately rather than ignoring it.
Diversification — spreading capital across multiple assets, sectors, or strategies — reduces the odds that one bad outcome wipes out a portfolio. It doesn't eliminate risk, it distributes it. Some traders formalize this further with explicit thresholds: one commonly referenced framework caps risk at 3% per individual trade, 5% across all open positions combined, and targets a minimum 7% profit-to-loss ratio. The specific numbers matter less than the principle — defining risk limits before you trade, not after.
From Understanding Market Mechanics to Building a Rule-Based Strategy
Once you understand how a bid becomes a fill, how an order moves price, and how risk should be sized, you have most of what a trading strategy actually needs. The remaining step is turning judgment into rules you can see and test.
Turning "buy low, sell high" logic into visible conditions
"Buy low, sell high" isn't a strategy — it's a direction. A real strategy defines when low is low enough: a price crossing below a moving average, an RSI reading under a threshold, a volume spike confirming a breakout. Each of these is a condition with a trigger point, and every one you'd normally eyeball on a chart can instead be written as an explicit rule: an entry condition, an exit condition, and a stop-loss.
Why seeing rule triggers on the chart builds confidence before automating
Automated trading platforms generally fall into a few camps: full coding environments for building custom logic from scratch, no-code or low-code builders for defining rules visually, signal-to-execution tools, and marketplaces of pre-built bots. The middle option is the natural next step for someone who's just learned market mechanics — instead of writing conditions as code, you place them on the chart, watch exactly where price would have triggered an entry or exit historically, and adjust thresholds when a rule fires too often (or not at all) before ever risking capital on it.
How to Start Trading or Investing
With the fundamentals in place, the practical path splits into two tracks depending on how you want to make decisions going forward.
Manual trading vs. building a tested, rule-based strategy
To start, you'll need a brokerage account — pick a broker or trading platform, verify identity, fund the account, and you can place your first order. From there:
- Manual trading means every entry and exit is a judgment call made in the moment, informed by the mechanics above but not locked into fixed rules.
- Rule-based trading means defining your entry, exit, and risk conditions ahead of time and testing them against historical price data — backtesting — before committing real capital. Backtesting and forward testing (running the strategy live on paper or small size) are both considered necessary stages before a strategy is trusted with real money; neither replaces the other.
Most traders who move from reacting to price toward systematic rules do both in sequence: build the logic, backtest it, then confirm it forward before scaling up.
Common Market Terms Explained
- Bid/Ask — the highest price a buyer will pay (bid) and the lowest a seller will accept (ask); the gap between them is the spread.
- Market index — a basket of stocks (e.g., S&P 500) used as a shorthand for overall market performance.
- IPO — the first sale of a private company's shares to public investors, raising capital and creating a tradable market for that stock.
- Diversification — spreading capital across different assets or strategies to reduce the impact of any single loss.
- Market order — an order to buy or sell immediately at the current available price.
- Limit order — an order set to execute only at a specified price or better, trading certainty of fill for price control.
Once you understand how market prices and orders actually work, the next step is turning that understanding into something testable instead of instinctive. Quberas lets you take the same entry, exit, and risk logic covered here and map it visually as a strategy — see exactly where each rule would trigger on the chart, backtest it against historical data, and launch it without writing a line of code.