TradingView Strategy Tester: Metrics & No-Code Guide
The TradingView Strategy Tester is a built-in backtesting engine that replays a coded trading strategy against historical price data and reports exactly how it would have performed — trade by trade. If you've been hunting for the panel and can't find it, or you've opened the Strategy Report and don't know what half the numbers mean, this guide covers all of it: where the tester lives, how to run a backtest step by step, what every metric actually tells you, and what to do if Pine Script is the wall you keep hitting.
What Is the TradingView Strategy Tester?
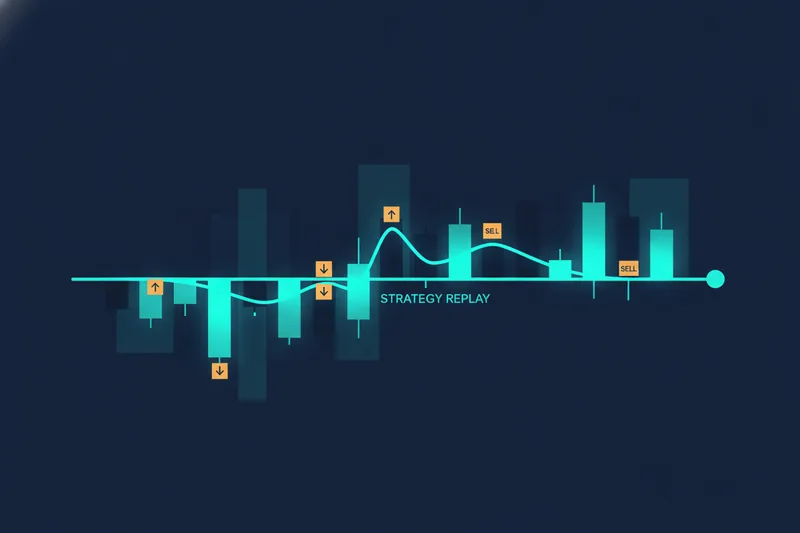
Backtesting is the practice of running a set of trading rules against historical price data to see how those rules would have performed. The TradingView Strategy Tester is the platform's native tool for doing exactly that — it simulates trades based on defined entry and exit conditions, then compiles the results into a structured report.
The core value is simple: before you risk real capital, you can see whether a strategy has any historical edge at all.
Indicators vs. Strategies: Why the Distinction Matters
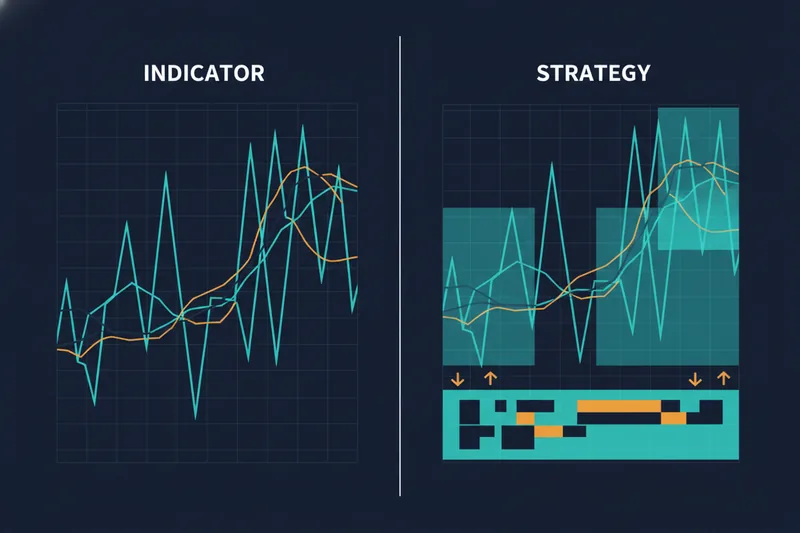
TradingView draws a hard line between two types of scripts. An indicator plots data on the chart — a moving average, RSI, Bollinger Bands — but it never places a trade. A strategy contains actual entry/exit conditions: rules that tell the system when to go long, when to go short, and when to close a position.
The Strategy Tester only activates when a strategy script is applied to the chart. An indicator, no matter how complex, will never trigger the panel. This single distinction is the source of most "I can't find the Strategy Tester" confusion.
What the Broker Emulator Does Behind the Scenes
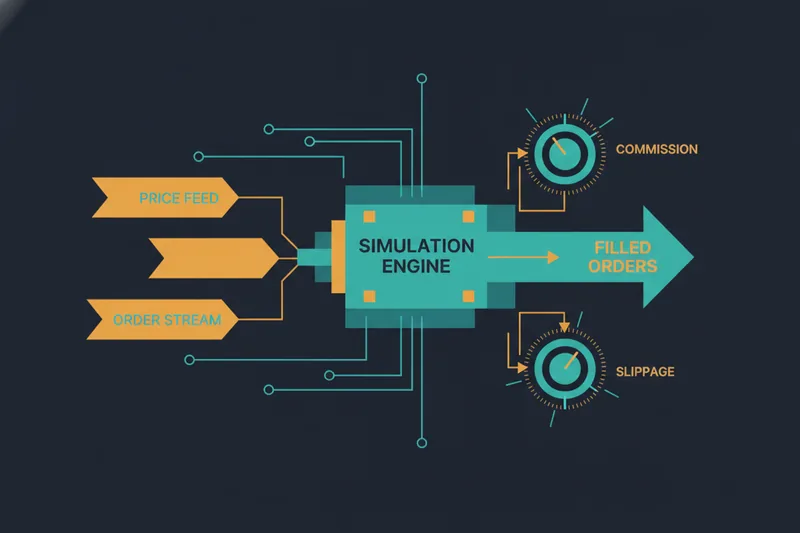
TradingView doesn't connect to a real exchange during a backtest. Instead, it uses a broker emulator — an internal simulation layer that models how orders would have been filled based on historical price data. The emulator allows you to configure inputs such as commission per trade and slippage (the difference between the expected fill price and the actual fill price). The settings you choose here directly affect how realistic your results are — a strategy that looks profitable with zero commission may be a net loser once realistic fees are applied.
How to Enable and Access the Strategy Tester in TradingView
The Strategy Tester panel appears within the TradingView chart interface — but only when a strategy script (not an indicator) is active on the chart. To get it visible:
- Open any chart in TradingView.
- Click the Indicators button in the top toolbar.
- In the search bar, type "strategy" — TradingView's built-in library includes several ready-made strategy scripts (e.g., "Supertrend Strategy," "MACD Strategy").
- Apply one to the chart. The Strategy Tester panel should appear.
Why the Strategy Tester Tab Is Not Showing
If the panel isn't there, the most common cause is that you've applied an indicator rather than a strategy. Strategy scripts are distinguishable from plain indicators in the library — look for scripts explicitly labeled as strategies. If you're looking at a plain indicator script, the panel will not appear. Switch to a strategy script and it should.
Free Plan vs. Paid Plan: What You Can Actually Access
The Strategy Tester is generally available to TradingView users, though the depth of what you can test varies by plan. Free accounts tend to have a more limited bar history, which shortens the backtest window, and may have restricted access to certain script features. Paid plans typically extend historical bar counts and unlock additional capabilities — which can materially change backtest results, especially on lower timeframes where bar count matters most. Check TradingView's current plan comparison page for the exact limits, as these change over time.
Mobile App: What TradingView's Strategy Tester Cannot Do
Full backtesting functionality is not available in the same form on TradingView's mobile app as it is on desktop. The mobile interface is primarily designed for chart viewing and basic indicator overlays. For running strategy backtests, a desktop browser is the more reliable environment.
How to Run a Backtest in TradingView: Step by Step
Configuring Strategy Properties Before You Run
Step 1 — Open a chart and select your symbol and timeframe. The timeframe you choose directly affects how many trades the strategy generates and how much historical data is available. A 1-hour chart on Bitcoin will produce far more trades than a daily chart on the same asset.
Step 2 — Apply a strategy script from the indicator library. All strategies in TradingView must be written in Pine Script, the platform's proprietary scripting language. You can use a built-in strategy or paste a Pine Script strategy you've sourced elsewhere. There is no native way to run a backtest without a Pine Script strategy applied.
Step 3 — Configure strategy properties. Click the gear icon on the strategy name that appears on the chart. The Properties tab lets you set:
- Initial capital — the simulated starting balance
- Commission — a percentage or fixed fee per trade, modeled on your actual broker
- Slippage — how many ticks of price movement to assume between signal and fill
These inputs are not cosmetic. A strategy that looks profitable with zero commission may be a net loser once realistic fees are applied.
Step 4 — Open the Strategy Tester panel at the bottom of the screen.
Step 5 — Read the Overview tab first. It gives you a high-level summary before you dig into individual trades.
One important distinction to keep in mind: a backtest runs on historical data that already exists. Forward testing — also called paper trading — runs the same strategy rules on live, incoming price data without real money. TradingView supports both, but they answer different questions. A backtest tells you what happened; forward testing tells you whether the strategy holds up in real market conditions going forward.
Reading the Overview Tab First
The Overview tab shows aggregate results: total net profit, number of trades, win rate, and max drawdown. Treat this as a triage screen. If the number of trades is very low (under 30–50), the results carry almost no statistical weight regardless of how good the profit looks.
Understanding the Strategy Report and Performance Metrics
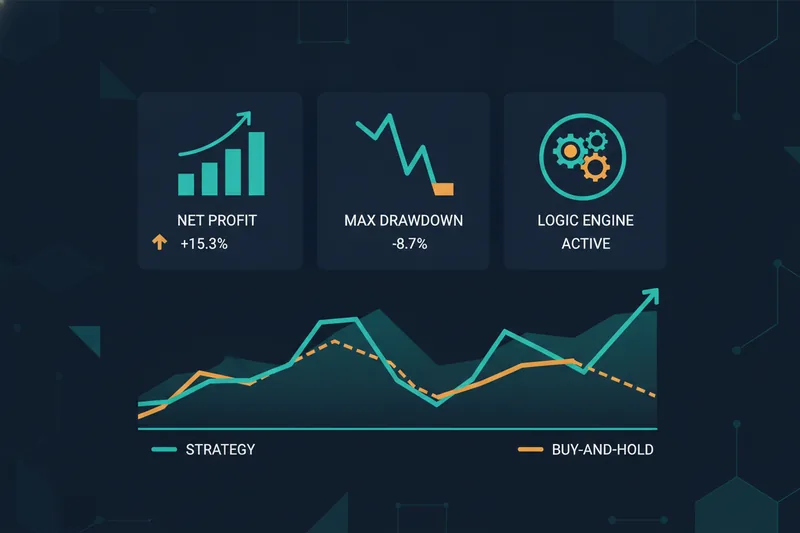
The Strategy Report organizes results across multiple tabs — typically an aggregate summary view, a breakdown of metrics by long and short trades, and a log of every individual trade with entry price, exit price, and P&L. The exact tab labels may vary by platform version, so use whichever view gives you the level of detail you need.
Net Profit and Drawdown: The Two Numbers That Matter Most
Net profit is the total gain or loss after all simulated trades, expressed in both currency and percentage. The percentage figure matters more than the absolute number — a $5,000 profit on a $10,000 account is a 50% return; the same $5,000 on a $500,000 account is nearly irrelevant.
Always compare net profit against the buy-and-hold return shown in the same report. If simply holding the asset over the same period would have returned more than your strategy, the strategy hasn't added value — it's just added complexity and transaction costs.
Max drawdown is the largest peak-to-trough decline in the account equity during the backtest period. It's a risk signal, not just a performance number. A strategy that returns 80% but experiences a 60% drawdown along the way is one most traders couldn't psychologically survive — they'd exit at the bottom and miss the recovery.
Sharpe Ratio and Profit Factor in Plain Language
The Sharpe ratio is a measure of risk-adjusted return — broadly, how much return the strategy generated per unit of risk taken. A higher Sharpe ratio generally indicates a more efficient strategy. Use it as a comparative signal between strategies rather than an absolute verdict on any single result.
Profit factor is the ratio of gross profit to gross loss. A profit factor of 1.5 means the strategy made $1.50 for every $1.00 it lost. Anything below 1.0 means the strategy lost money overall. Profit factor is often more informative than win rate alone — a strategy can win only 40% of its trades and still be highly profitable if the average winner is much larger than the average loser. Chasing a high win rate without checking profit factor is one of the most common evaluation mistakes.
The 3-5-7 Rule: A Simple Framework for Evaluating Any Strategy
The 3-5-7 rule is a practical risk management framework used to screen whether a strategy is worth pursuing. As commonly described, it works like this:
- 3% — risk no more than 3% of your capital on any single trade
- 5% — limit total portfolio exposure to no more than 5% across correlated positions
- 7% — exit any trade that moves 7% against you, without exception
The underlying principle is consistent regardless of exact interpretation: limit downside per trade, control correlated exposure, and define your exit before you enter. Apply it as a first-pass filter before spending hours optimizing parameters.
The Core Limitation: TradingView's Strategy Tester Requires Pine Script
Every strategy that runs in TradingView's Strategy Tester must be written in Pine Script. This is not a workaround situation — it's a fundamental architectural requirement of the platform. Pine Script is TradingView's proprietary scripting language, and the platform's native interface for building strategies is code-based.
What this means practically: you can load and run any of TradingView's built-in strategy scripts, and you can run Pine Script code you've copied from a public source. But if you want to define your own logic — your own indicator combinations, your own entry triggers, your own exit rules — you have to write that logic in code.
Within TradingView's native environment, there is no visual interface for assembling strategy conditions without writing script. Every rule lives inside a Pine Script file, and if you can't read or write that language, you're limited to testing strategies other people have already built.
Free-plan users face an additional layer of restriction: fewer historical bars, limited script access, and no ability to use certain premium data sources that some strategies require. The Strategy Tester is genuinely powerful — it's one of the most capable browser-based backtesting tools available — but it is code-first by design, and that's a real wall for traders who don't program.
What No-Code Traders Can Do Instead: Visual Backtesting Without Pine Script
If the Pine Script requirement is the bottleneck, the practical answer is a no-code strategy builder — a tool that lets you define entry and exit conditions through a visual interface rather than a text editor.
How a Visual Strategy Builder Replaces Pine Script
Instead of writing ta.crossover(ema9, ema21) in a script, a visual builder lets you select indicators from a list, set the condition (crossover, above, below, equals), and connect them together — no syntax, no compiler errors, no documentation lookup. The logic you'd normally write in code is assembled through a drag-and-drop deal map: a visual representation of your strategy's full structure, from entry conditions through averaging orders to exits and stop-losses.
A visual condition builder supports the same types of logic that Pine Script handles — price-based rules, indicator values, volume conditions, crossovers, nested AND/OR logic — but expresses them as connected blocks rather than lines of code.
Seeing Your Rules on the Chart: Why Visual Debugging Changes the Workflow
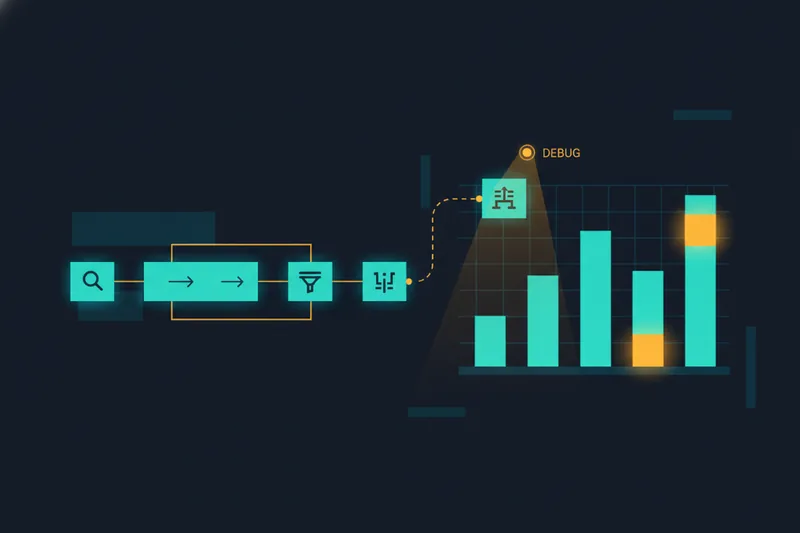
One of the most underappreciated problems with code-based backtesting is debugging. When a strategy fires at the wrong time, you have to read the code to figure out why. A visual debugger solves this by highlighting the exact chart zones where each condition triggered — you can see, bar by bar, why the entry fired or didn't fire.
Quberas is built around this workflow: construct your strategy visually using the deal map and condition builder, then see exactly where your rules trigger directly on the chart before you run the full backtest. The same build → backtest → launch sequence that TradingView offers exists here — without a single line of Pine Script required.
This approach is designed for traders who have outgrown manual execution and want to systematize their strategy, but who can't or won't write code. The no-code strategy builder category exists precisely because the gap between "I have a strategy idea" and "I can implement it in Pine Script" is wide enough that most retail traders never cross it.
Frequently Asked Questions
Why can't I find the Strategy Tester in TradingView? The Strategy Tester panel only appears when a strategy script — not an indicator — is applied to the chart. Open the Indicators library, search for a built-in strategy, apply it, and the panel should appear. If you've applied an indicator instead, it will not show.
Is the TradingView Strategy Tester free? The Strategy Tester is generally available to TradingView users across plans, but the scope of what you can test differs. Free accounts typically have a shorter bar history and fewer script features. Paid plans extend these limits. Check TradingView's current plan page for the latest specifics.
Does TradingView Strategy Tester work on mobile? Full backtesting functionality is not available in the same form on TradingView's mobile app as it is on desktop. The mobile interface is built primarily for chart viewing. For running strategy backtests, a desktop browser is the recommended environment.
What is the difference between backtesting and forward testing? Backtesting runs your strategy rules against historical data that already exists. Forward testing (paper trading) runs the same rules on live price data without real money. Backtesting tells you how a strategy would have performed in the past; forward testing tells you whether it holds up in real-time market conditions.
What is the 3-5-7 rule in trading strategy? The 3-5-7 rule is a risk management framework: risk no more than 3% of capital per trade, keep total exposure across correlated positions to no more than 5%, and exit any trade that moves 7% against you. Use it as a directional filter to quickly assess whether a backtest result reflects sound risk discipline.
Can I backtest without Pine Script? Not within TradingView's native environment — every strategy there requires Pine Script. If you want to backtest a custom strategy without writing code, you need a dedicated no-code strategy builder that lets you define conditions visually and run the backtest through its own engine.
Ready to backtest your own strategy without writing a single line of Pine Script? Try Quberas — build your entry and exit conditions visually, see exactly where they trigger on the chart, and run your backtest in minutes.