AI Trading: Build & Test Strategies Without Code | Quberas
AI trading is a broad term that covers everything from tools generating market commentary to fully automated bots executing orders around the clock. Before you commit to any platform, you need to know which category you're actually looking at — and whether it gives you real control over the logic driving your money. This guide breaks down what AI trading means in practice, how the execution loop works, and how a visual no-code strategy builder lets you construct, test, and debug automated strategies with full on-chart transparency.
What AI Trading Actually Means
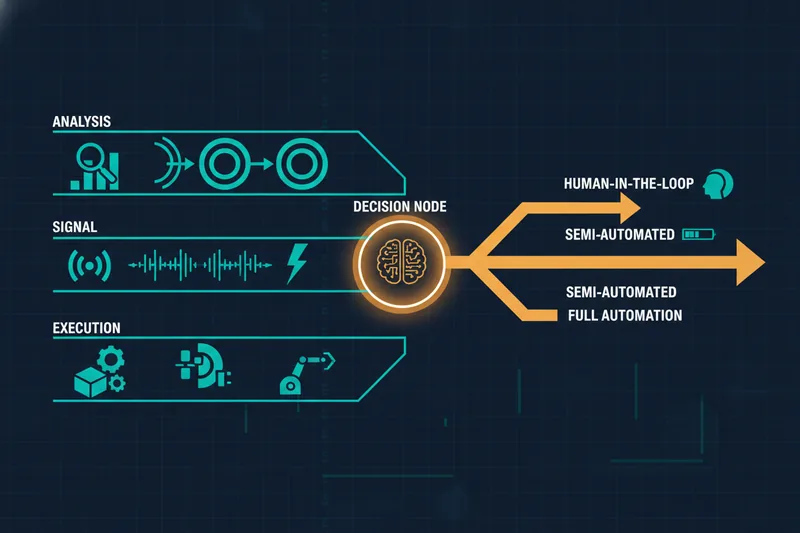
AI analysis vs. AI execution: why the difference matters
"AI trading" gets applied to at least three distinct things: tools that analyze markets and surface insights, tools that generate trade signals, and tools that actually execute orders autonomously. Conflating them leads traders to either over-trust a black box or under-use a tool that could genuinely help.
When a platform claims to use AI for trading, the first question is: does it execute trades, or does it inform your decisions? An analysis tool might highlight support levels or summarize sentiment. A signal tool sends alerts when conditions look favorable. An execution bot — what most traders actually mean when they say "AI trading bot" — places and manages orders without you clicking a button.
Rule-based automation vs. machine-learning bots
Algorithmic trading strategies can take different forms depending on how the underlying logic is constructed. Machine-learning bots are designed to identify patterns in historical data and, in some implementations, adjust behavior over time. Their decision logic can be difficult to inspect, depending on how the platform exposes it — you may not be able to see exactly why a specific trade was placed.
Rule-based automation works differently: you define explicit conditions ("if RSI crosses below 30 and price is above the 200-period moving average, open a long"), and the bot executes exactly those rules. No hidden model, no black box. The logic is yours to read, edit, and audit.
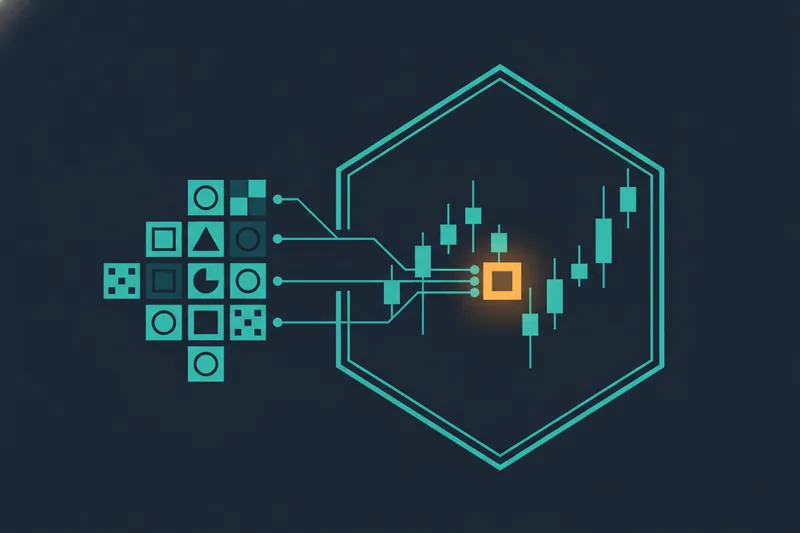
It's also worth clarifying where large language models (LLMs) like ChatGPT fit. While some LLM-integrated systems have been built with exchange connectivity, a general-purpose LLM on its own is not a trading execution engine — it does not manage live orders or connect to your brokerage by default. Knowing the difference stops you from comparing a research assistant to an execution system.
How AI Trading Tools Work
From market data to trade decision: the execution loop
Every automated trading tool — regardless of how it's marketed — runs the same basic loop: read market data, evaluate conditions, decide whether to act, send an order if conditions are met, then repeat.
OHLCV data (Open, High, Low, Close, Volume) captures what price did over each time period and is a common input format for strategy conditions. More granular inputs — bid/ask data and order-book-derived data — capture the live spread and depth of the market, which matters for strategies sensitive to execution price rather than just candle closes.

The bot reads this data continuously, checks it against your defined rules, and fires an order when conditions align. Market structure and session timing vary across asset classes — crypto trading and stock trading each have their own liquidity windows and trading hours that are worth accounting for when you design and test your rules.
Where technical indicators fit in
Technical indicators — RSI, MACD, Bollinger Bands, moving averages, volume oscillators — are common building blocks for rule-based strategies. They transform raw price and volume data into signals your conditions can reference. An indicator alone does nothing; it becomes useful when you attach a condition to it ("RSI crosses above 70 → consider exit") and wire that condition into an execution rule.
The quality of your strategy depends on how precisely you define those conditions and how they interact with each other.
Types of AI Trading Tools: Bots, Analyzers, and Signal Tools
Black-box AI bots: what you give up for convenience
Some platforms offer fully managed AI trading bots where you deposit funds, set a risk level, and let the system trade. The appeal is obvious — minimal setup. The trade-off is that you cannot see the logic, cannot audit why a trade was placed, and cannot adjust individual rules when market conditions shift. If the bot underperforms, you have no diagnostic path. This is the black-box trust problem: you're betting on outcomes without understanding the process.
No-code visual builders: automation with logic you can inspect
No-code trading automation sits between black-box bots and writing code from scratch. A visual strategy builder lets you define your own entry and exit rules, connect indicators, set stop-losses, and see the full logic laid out in a structured interface — without a single line of code.
The key advantage is transparency. You own the logic, you can read it, and you can change specific parameters without rebuilding everything. This category suits traders who have a clear strategy in mind but lack programming skills, or who want faster iteration than code allows. Most visual builders offer free tiers or trial access, making them low-risk to evaluate before committing to a paid plan.
Signal and analysis tools: useful inputs, not execution
Signal tools alert you when conditions are met — they do not trade for you. Market analyzers surface patterns, sentiment, or statistical summaries. Both are useful as inputs to your thinking, but they require you to act on the signal manually or pipe it into a separate execution layer. They are not a complete automation solution on their own.
How to Build an AI Trading Strategy Without Code
Mapping your strategy stages: entry, averaging, exit, stop-loss
A complete automated strategy is not a single rule — it's a sequence of stages. A deal map is a visual representation of that sequence: you see each stage (entry, averaging, exit, stop-loss) as a connected node, and you can trace the path a trade takes from open to close.
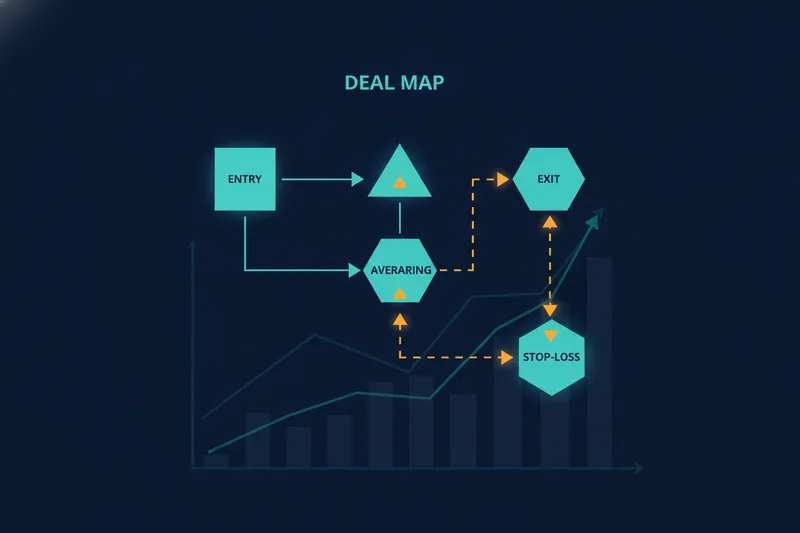
Entry conditions define when the bot opens a position. Averaging orders add to the position at defined intervals or price levels, which can affect your average cost across the trade. Exit conditions close the trade when your profit target or signal criteria are met. Stop-loss logic caps your downside if the trade moves against you.
Laying this out visually — rather than burying it in parameter fields — makes it immediately clear whether your stages are connected correctly and whether any logic is missing.
Building conditions with indicators and price rules
A puzzle-style condition builder lets you combine multiple inputs into a single condition without writing code. You might combine a price rule ("close is below the lower Bollinger Band") with a volume condition ("volume is above its 20-period average") and a crossover ("MACD line crosses above signal line") using AND/OR logic.
Nested logic — conditions within conditions — lets you handle more complex scenarios: "if condition A is true AND (condition B OR condition C) is true, then trigger." This is the same logic a developer would write in code, expressed as a visual structure you can read and edit directly.
Seeing your logic on the chart before going live
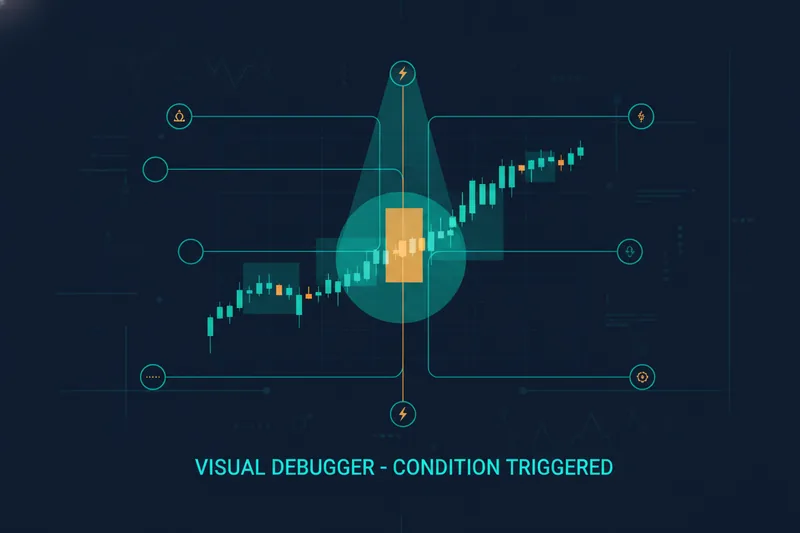
The critical step before live deployment is verifying that your rules trigger where you expect them to. A visual debugger highlights the exact chart zones where each condition was active, so you can see whether your entry fired at the right candle, whether the stop-loss level made sense given the price action, and whether any conditions conflicted. Quberas builds this on-chart visibility directly into the workflow — you see rule triggers on the chart, not just in a log file.
Backtesting Your AI Trading Strategy
Backtesting runs your strategy against historical market data to estimate how it would have performed. It is the essential step between building a strategy and risking real capital. Without it, you are guessing.
What data quality determines in your backtest results
The reliability of your backtest depends heavily on the data feeding it. OHLCV data is sufficient for strategies that trigger on candle closes. Strategies sensitive to intrabar price movement — scalps, tight stop-losses — benefit from more granular inputs: bid/ask data or order-book-derived data that captures what actually happened inside a candle, not just its endpoints.
Poor data quality produces misleading results. A strategy that looks profitable on low-resolution data may fail in live trading because the execution price was never actually available at the moment the candle closed.
Comparing strategy variations before committing capital
Backtesting also lets you compare variations: tighter stop-loss vs. wider, different indicator periods, different averaging intervals. Running these side by side on the same historical data gives you an evidence-based basis for choosing parameters — rather than picking numbers that feel right. What backtesting cannot guarantee is future performance. Markets change, and a strategy that performed well on past data may encounter conditions it was never tested against.
Debugging and Tuning: Why Your Bot Triggered (or Almost Did)
Reading the visual debugger: what each chart zone tells you
One of the most common reasons traders abandon bots is that they cannot explain a trade. The bot fired, the trade lost, and there is no way to trace back through the logic. A visual debugger solves this by mapping each condition to a visible zone on the chart.
You can see not just where a condition triggered, but how close it came to triggering on candles where it did not. This "almost triggered" visibility is diagnostic information that a log file or a parameter table cannot give you. It shows you whether your threshold is too tight (firing on noise) or too loose (missing valid signals).
Reducing noise-driven entries by tuning thresholds
False signal reduction is about identifying the conditions that fire on market noise rather than meaningful price action, then adjusting the thresholds that govern them. If your RSI entry condition triggers on every minor dip, you can see that pattern in the chart zones and raise the threshold — or add a confirming condition — to filter out the low-quality entries.
Threshold tuning without visual feedback is guesswork: you change a number, rerun the backtest, and hope the result improves. With chart-zone visibility, you can see exactly which candles the old threshold caught and whether the new one filters them correctly. This turns parameter adjustment from trial-and-error into a diagnostic process.
Risks and Limitations of AI Trading
Automated trading does not remove risk — it systematizes it. Understanding what these tools cannot do is as important as knowing what they can.
Overfitting is a well-known backtesting risk. A strategy tuned to perform well on a specific historical period may have captured the noise of that period rather than a durable pattern — looking strong in the backtest and underperforming immediately in live trading.
Market regime changes — shifts from trending to ranging conditions, volatility spikes, liquidity crises — can invalidate rules that worked reliably in a different environment. No rule-based system adapts to regime changes automatically unless you build that adaptation in explicitly.
Execution risk and slippage mean the price at which your order fills may differ from the price at which your condition triggered, especially in fast-moving or thin markets. Backtests typically assume clean fills; live trading does not guarantee them.
Logic transparency — knowing exactly what your bot is doing — reduces the black-box trust problem and makes it easier to diagnose failures. But transparency does not eliminate the underlying market risks. It just means you can act on what you learn.
Risk management at the strategy level — stop-losses, position sizing, loss limits, cooldown periods after a stop is hit — is the structural layer that keeps a bad run from becoming a catastrophic one.
How to Get Started with AI for Trading
Choosing the right tool: questions to ask before you commit
Before selecting a platform, answer these questions:
- Can I see the logic? If you cannot inspect why a trade was placed, you cannot improve the strategy or trust it during a drawdown.
- Does it execute, or just signal? Make sure the tool actually connects to your exchange and places orders — not just alerts you.
- What data does the backtester use? OHLCV-only or more granular bid/ask data? The answer affects how much you can trust the results.
- Can I start without committing capital? A free tier or trial lets you build and backtest before risking anything.
- What risk controls are available? Stop-loss, per-trade limits, and cooldown settings should be configurable at the strategy level.
Starting from a ready-made strategy vs. building from scratch
If you are new to automation, a strategy marketplace is a practical starting point. You select an existing strategy, review its logic (if the platform exposes it), set your own risk parameters, backtest it on your target market, and go live. This is faster than building from scratch and gives you a working reference point to learn from.
Building from scratch gives you full control and lets you systematize a strategy you already trade manually. The deal map approach makes this accessible even without coding experience — you map your existing rules into the visual interface stage by stage.
Either way, set your risk parameters before going live. Define your stop-loss, your maximum position size, and your loss limits. Test the strategy on historical data. Use the visual debugger to confirm the logic fires where you expect it to. Only then connect to live capital.
Try building your first automated trading strategy on Quberas — no code required. See your logic on the chart before you risk a single dollar.