Grid Trading Explained: Build & Backtest
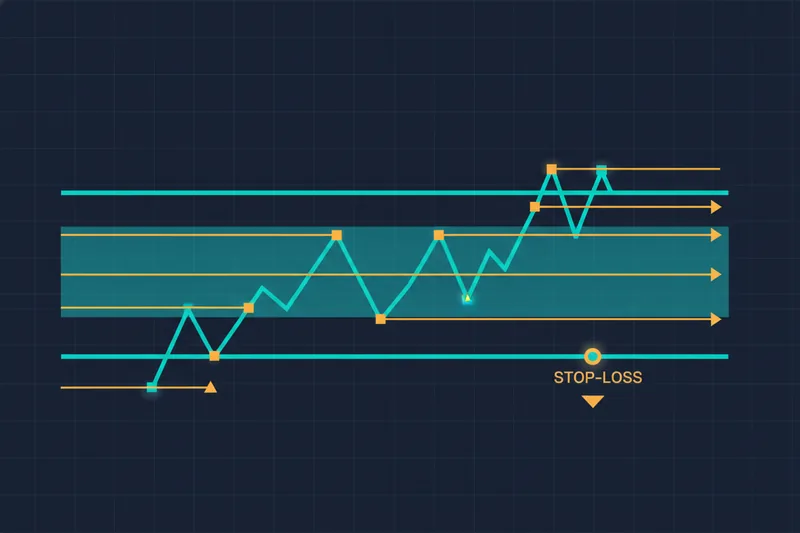
Grid trading is a strategy that places a ladder of buy and sell orders at fixed intervals across a price range, letting a bot capture small profits automatically as price oscillates up and down inside that range. It doesn't try to predict direction — it profits from volatility itself, buying dips and selling bounces without you watching a chart all day. It works best in a ranging/sideways market, where price keeps bouncing between a floor and a ceiling instead of trending hard in one direction.
What Is Grid Trading?
A grid trading bot is a piece of automation that divides a chosen price range into evenly spaced levels — the "grid" — and places a buy order below the current price and a sell order above it at each level. As price moves down, it buys; as price moves back up, it sells at the next level for a small profit. Repeat that across dozens of levels and a sideways-drifting asset can generate a steady stream of small wins, even though the price ends up roughly where it started.
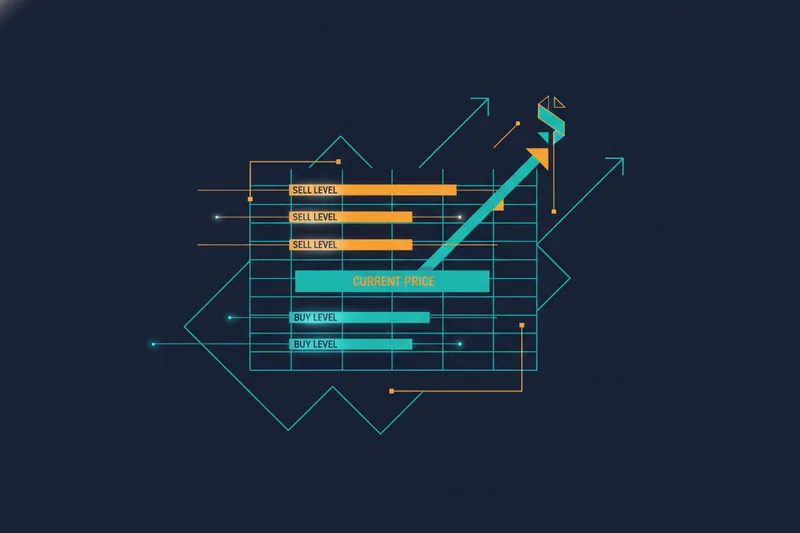
The concept sounds simple, but most explanations stop at the definition and never show what it actually looks like when a level triggers, or what happens when price breaks out of the range entirely. That gap — between "here's the theory" and "here's what my bot will actually do at 2am" — is exactly where traders get burned. It's also the problem a visual platform like Quberas is built to solve: instead of trusting a black-box parameter panel, you see each buy/sell order and its trigger point plotted directly on the chart before you risk a dollar.
How Does Grid Trading Work?
Mechanically, a grid strategy runs on three inputs: a price range, a number of grid levels, and an order size per level. Say Bitcoin is trading at $60,000 and you set a range of $55,000–$65,000 with 10 grid levels. That spaces orders roughly $1,000 apart. The bot places buy orders at each level below current price and sell orders at each level above it.
As price ticks down through $59,000, $58,000, and so on, the buy order at each level fills. When price recovers and climbs back through those same levels, the corresponding sell orders fill, locking in the difference. This is the "buy low, sell high" automation that makes grid trading attractive: it doesn't require you to time entries manually, and it keeps working as long as price keeps oscillating within the price range. The catch is that the whole mechanism depends on continued back-and-forth movement — high volatility inside the range is what generates trade volume and profit; a flat, illiquid range just sits there doing nothing, and a range that gets broken decisively stops the grid from doing what it's designed to do.
Types of Grid Trading Strategies
Grid strategies vary along two independent axes: how the levels are spaced, and which market direction the grid is built to profit from.
Arithmetic vs. Geometric Grid Spacing
An arithmetic grid spaces levels at equal dollar (or point) intervals — $1,000 apart regardless of price level. A geometric grid spaces levels at equal percentage intervals instead, so the dollar gap widens as price rises and narrows as price falls. Arithmetic grids are easier to reason about and common for assets with modest expected price swings; geometric grids adapt better to assets that can move a large percentage in either direction, since the level spacing scales with price rather than staying fixed.
Neutral, Long, and Short Grid Strategies
A neutral grid strategy places the range symmetrically around the current price with no directional bias — it profits from oscillation regardless of which way price eventually drifts, as long as it stays inside the range. A long grid strategy biases the range and order sizing toward an expected upward move, buying more aggressively on dips within an uptrend. A short grid strategy does the reverse, biasing toward a downtrend and profiting as price grinds lower through the grid. Choosing between them depends entirely on your read of the broader trend the range sits inside — a neutral grid on an asset that's actually trending hard in one direction is a common way traders get caught out.
Grid Trading Example: Step-by-Step
Take a concrete case: ETH is consolidating between $2,800 and $3,200 after a sharp rally, showing the sideways behavior of a ranging/sideways market. You decide to run a neutral grid.
- Set the price range: $2,800 (floor) to $3,200 (ceiling).
- Choose grid levels: 8 levels, spaced arithmetically about $50 apart.
- Place orders: buy orders at each level below $3,000 (current price), sell orders at each level above it.
- Add a stop-loss: set below the floor, say $2,700, so a decisive breakdown closes the grid instead of letting it keep buying into a collapse.
- Add a take-profit: set above the ceiling, say $3,300, to lock in gains and exit cleanly if price breaks out upward instead of reverting.
As ETH oscillates between $2,850 and $3,150 over the next two weeks, buy and sell orders fill repeatedly at each level, harvesting the range. If ETH instead breaks below $2,700, the stop-loss and take-profit levels you defined close the position instead of leaving the grid to average down indefinitely into a falling market.
Is Grid Trading Profitable?
Grid trading is profitable specifically when price stays inside the defined range and keeps generating enough round trips through the grid levels — it is not a strategy that performs consistently across all conditions. In a genuine ranging/sideways market with decent volatility, a well-sized grid can produce a steady sequence of small wins. In a market that trends strongly in one direction, a neutral grid either sits mostly unfilled (if price only moves one way through the range) or gets run over entirely once price breaks the range boundary.
The honest answer to "is it profitable" is: it depends on whether the market conditions match the grid's assumptions, and you don't know that in advance without testing. This is where backtesting — running the strategy against historical price data to see how it would have performed — matters more for grid trading than for most strategies, because grid performance is so sensitive to the specific range and spacing chosen. Backtesting and forward testing (running the same strategy live on paper or small size before committing real capital) are generally both treated as required steps before a strategy earns real money, not optional extras. A useful sanity check once you have backtest results is the strategy's Sharpe ratio — a measure of return relative to volatility — where a ratio above 1.0 is considered acceptable and above 2.0 is considered strong; a grid that only looks good on raw return but shows a weak Sharpe ratio is often just riding volatility, not skill.
Risks and Downsides of Grid Trading
The core risk of grid trading is a trending market masquerading as a ranging one. Once price breaks decisively through the floor or ceiling, a grid without a stop-loss keeps buying into a falling market or keeps missing a rising one, and drawdown accumulates fast. Setting real stop-loss and take-profit levels at the edges of your range isn't optional risk hygiene here — it's the difference between a contained loss and an open-ended one.
The second risk is subtler: false signals in choppy markets, where price wicks just past a grid level and back without real follow-through, filling orders that immediately reverse and cost you the spread repeatedly. This is where threshold tuning earns its keep. Rather than guessing at spacing, a visual debugger that shows how close price came to triggering a level — an "almost triggered" versus "triggered" comparison — lets you see which levels are getting whipsawed by noise and widen the spacing there, instead of tightening a bot's parameters blind and hoping. This near-miss analysis is the piece most grid trading explainers skip entirely, and it's usually the difference between a grid that bleeds on noise and one that only fires on real moves.
Best Grid Trading Bots and Platforms
Grid trading tools generally fall into three groups. Binance grid trading and similar native exchange tools are the most accessible — built into the exchange, free to use, and limited to a single range/spacing/stop-loss configuration with little visibility into why an order fired. Dedicated bot platforms sit a level up, often offering more configuration and backtesting, though many still expose logic through parameter fields rather than showing it. Automated trading platforms broadly split into full coding environments, no-code/low-code builders, signal-execution layers, and pre-built bot marketplaces — and some, like AlgoBuilder, still lean on code-based approaches such as Python rather than a purely visual interface. Other bot platforms specialize by asset class, running crypto, stocks, and forex through separate sister products rather than one unified builder.
A no-code visual builder folds grid trading into a broader deal map — a visual flow of entry, averaging, exit, and stop-loss stages — so a grid isn't an isolated exchange feature but one configurable module inside a larger strategy. A visual debugger on top of that highlights exactly which chart zone corresponds to each condition, which is what makes threshold tuning and near-miss analysis practical instead of theoretical.
How to Set Up a Grid Trading Strategy Without Code
Define Your Price Range and Grid Levels
Start from recent price action, not a round number. Look at the last few weeks of consolidation to find a realistic floor and ceiling for your price range, then decide on arithmetic or geometric spacing based on how much the asset typically swings in percentage terms.
Backtest Before Going Live
Run the grid against historical data covering both a genuine ranging period and at least one breakout, so you can see how the strategy behaves in both. Backtesting should tell you not just total return but how the grid performs when the range gets broken — that's the scenario most traders skip testing and then get surprised by live.
Tune Thresholds to Reduce False Signals
Once backtest results are in, look at which grid levels triggered on noise versus real moves. Widen spacing around levels that show frequent near-misses and reversals, and keep tight spacing where price genuinely respects the level. This is the same threshold-tuning process used to cut down on false signals in choppy conditions, applied before risking capital rather than after a losing streak.
Add Risk Controls and Launch or Publish Your Strategy
Set your stop-loss and take-profit levels at the range boundaries, and layer in risk controls at the strategy level — a maximum loss per run and a cooldown after stop-loss that pauses re-entry for a set period instead of immediately re-opening the same grid into a market that just proved it's trending. If you're running this live rather than in a backtest, note that a home PC can work for testing, but running a bot continuously with real capital is generally where traders move to more reliable, always-on infrastructure. Once the strategy is tuned and tested, you can launch it for your own use or list it on a strategy marketplace for other traders to run under their own risk settings.
Grid Trading FAQ
Is grid trading risky? Yes, particularly in trending markets. The main risk isn't any single trade but a range break that leaves the grid buying into a falling market or missing a rising one without a stop-loss in place.
Grid trading vs. DCA — what's the difference? Dollar-cost averaging (DCA) buys at fixed intervals regardless of price, aiming to smooth out entry price over time. Grid trading buys and sells at fixed price levels regardless of time, aiming to profit from oscillation within a range. DCA is direction-agnostic about entry cost; grid trading is range-dependent about ongoing profit.
What are the best market conditions for grid trading? A ranging or sideways market with meaningful volatility inside the range — enough back-and-forth movement to fill both buy and sell orders repeatedly, without a strong prevailing trend that eventually breaks the range.
See exactly how a grid strategy triggers on the chart — build, backtest, and tune your own grid trading bot visually with Quberas, no coding required.