Day Trading Strategies: Pick, Test & Automate | Quberas
Day trading strategies are everywhere online — but most lists stop at naming them. This guide goes further: it explains how each strategy's logic actually works, what entry and exit rules look like in practice, how to validate those rules before risking real capital, and how to move from manual execution to a systematic, automated approach.
What Day Trading Actually Is (and What Makes a Strategy Work)
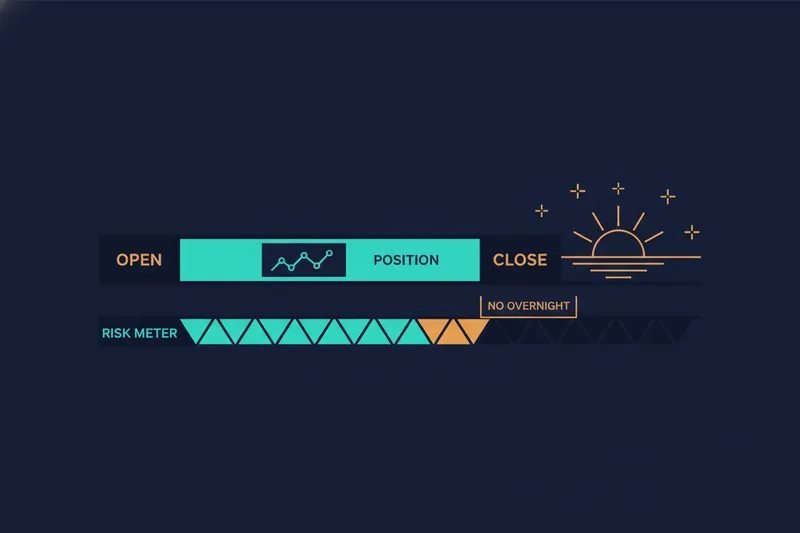
Day trading is a style in which positions are opened and closed within the same trading session, avoiding overnight exposure. That single constraint shapes everything: you need fast setups, defined exits, and tight risk control, because there is no "wait and see until tomorrow."
A strategy is not a pattern you recognize on a chart. It is a repeatable set of rules that tells you, without ambiguity, when to enter, when to exit, and how much to risk. Three components are non-negotiable:
- Entry condition — the specific signal or combination of signals that triggers a trade
- Exit condition — the target price or signal that closes the trade at a profit
- Stop-loss — the price level at which the trade closes to cap the loss
Most traders have a rough idea of all three. Fewer have written them down precisely enough to apply them the same way twice. That gap — between a vague approach and a defined ruleset — is the difference between discretionary trading and a systematic strategy. Discretionary execution means your judgment (and your mood) filters every decision. A systematic strategy removes that filter. And once rules are precise enough to write down, they are precise enough to codify and automate.
The Core Day Trading Strategies Explained
Trend Trading
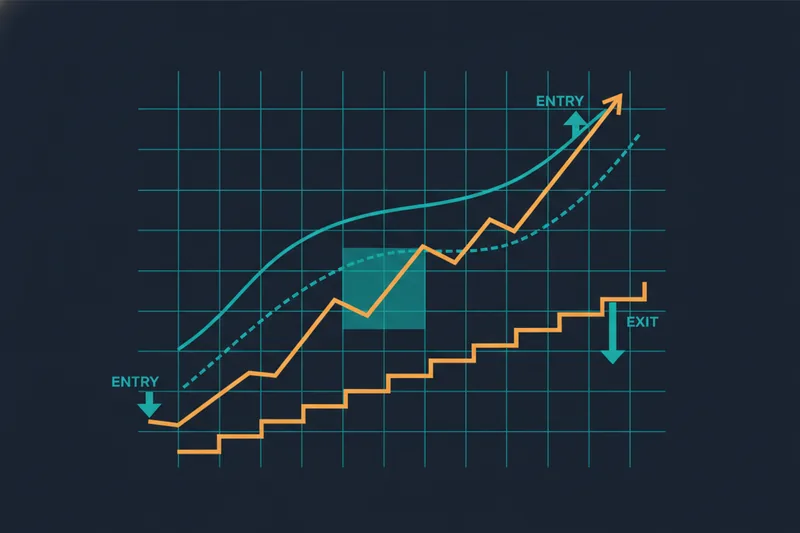
Trend trading means trading in the direction of an established price trend — buying in uptrends, selling in downtrends. The underlying logic is simple: a market in motion tends to stay in motion.
Identifying trend direction typically involves moving averages — shorter-period EMAs smooth out noise and show the prevailing direction, while longer-period ones provide broader context. The ADX (Average Directional Index) is a technical indicator traders use to assess trend conditions; readings and thresholds vary by market and timeframe, so traders calibrate it to their own setup rather than applying a universal number.
Entry logic: wait for a continuation signal — a pullback that holds above the moving average, or a short consolidation that resolves in the trend direction. Exit logic: trail the stop below successive higher lows (in an uptrend) rather than targeting a fixed price, so you stay in as long as the trend holds.
Momentum Trading
Momentum trading exploits the rate of price change — the idea that assets moving strongly in one direction tend to keep moving, at least briefly. The entry is not on the trend itself but on the surge.
Entry logic: look for a volume-confirmed breakout — price moving sharply with above-average volume signals genuine participation, not a thin-market spike. RSI (Relative Strength Index) and MACD are commonly used momentum indicators; traders watch for readings and histogram behavior that align with the direction of the move, though the specific thresholds depend on the asset and timeframe. Exit logic: momentum fades before price reverses, so exits are often time-based or triggered when volume drops sharply or RSI starts rolling over. Holding too long is the most common momentum mistake.
Scalping
Scalp trading compresses the holding period to seconds or minutes, targeting small price increments many times per day. The edge comes from frequency and consistency, not from large individual wins.
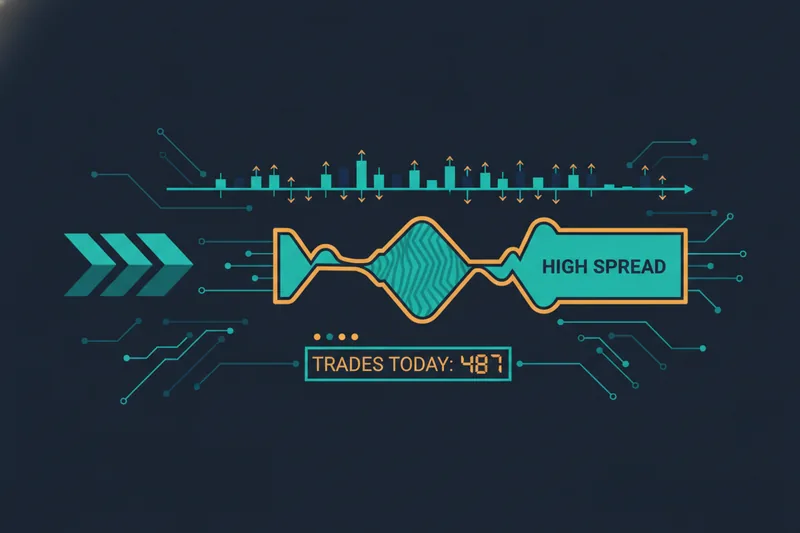
Because margins are thin, tight spreads matter enormously — scalping illiquid markets or during wide-spread conditions destroys the edge immediately. Entry and exit signals rely on short-period EMAs, order flow, and Level 2 data to read real-time supply and demand; the specific periods traders choose vary by instrument and session. Scalping demands full attention for the entire session and is the least forgiving strategy for slow execution or emotional hesitation.
Mean Reversion and Range Trading
Mean reversion is built on the assumption that price, after moving to an extreme, tends to return toward its average. Range trading is the practical application: when a market is oscillating between defined support and resistance levels, you buy near the bottom of the range and sell near the top.
Bollinger Bands are a widely used tool for mean reversion — price touching or breaching the outer band can signal a potential reversion. RSI in elevated or depressed territory adds confirmation; traders typically define their own overbought and oversold thresholds rather than applying fixed numbers universally. Entry: near the support or resistance extreme. Exit: at the midpoint of the range (the moving average) or the opposite extreme. The strategy breaks down in trending markets, so confirming that the market is actually ranging before entering is essential.
Breakout Trading
Breakout trading enters when price exits a defined range or pattern — a consolidation box, a triangle, a key resistance level — on the assumption that the breakout signals the start of a new directional move.
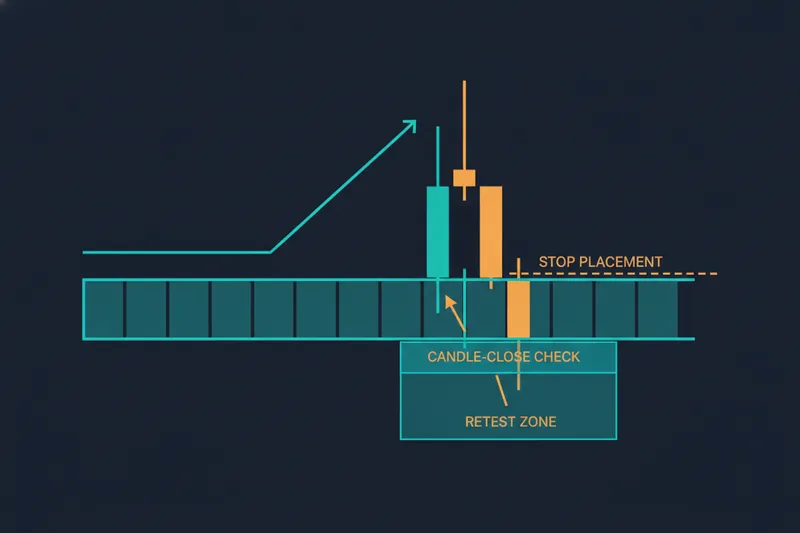
The main risk is false breakouts: price briefly pierces a level, triggers entries, then reverses. Confirmation signals — a candle close beyond the level, volume expansion, or a retest of the broken level as new support — reduce but do not eliminate this risk. Stop placement goes just below the breakout level (for long breakouts), keeping the loss small if the move fails.
Pullback Trading
Pullback trading is often confused with breakout trading, but the entry point is different. Instead of entering at the breakout, you wait for price to retrace after the breakout and enter on the pullback — buying the dip within an established trend rather than chasing the initial move.
Fibonacci retracement is a tool traders use to identify potential pullback zones — price levels derived from Fibonacci ratios that traders watch for possible pauses or reversals within a retracement. Moving averages act as dynamic support — a pullback that holds a key EMA in an uptrend is a classic entry trigger. The advantage over breakout entries: better price, tighter stop, improved risk/reward. The disadvantage: sometimes the pullback never comes and you miss the move.
News-Based Trading
News-based trading positions around scheduled catalysts — earnings releases, macroeconomic data, central bank decisions — or reacts to breaking news. The edge is volatility: large moves happen fast.
The risks are equally large. Slippage during high-volatility events can turn a planned entry into a significantly worse fill. Spreads widen. Direction is often unpredictable even when the news itself is predictable. News trading rewards speed and preparation (knowing the schedule, having levels pre-defined) and punishes reactive, unplanned entries.
The 3-5-7 Rule: A Simple Risk Framework for Day Traders
The 3-5-7 rule is a risk management framework that structures how much exposure a trader takes on at any given time. One common interpretation defines it around three thresholds: a limit on risk per individual trade, a cap on total open risk across all active positions, and a minimum reward target on winning trades to keep overall expectancy positive. The numbers most often cited are in the range of 3%, 5%, and 7% respectively, though these are a rule of thumb — traders adapt them based on their volatility tolerance, account size, and strategy characteristics.
The underlying principle is what matters: cap single-trade risk, cap total exposure, and maintain a positive reward ratio. Those three constraints together protect capital across a losing streak, ensuring that a normal run of bad trades remains a recoverable drawdown rather than an account-ending event.
In practice, the per-trade risk limit translates directly into a position size. If you know your maximum acceptable loss on a trade and where your stop-loss sits, you can back-calculate how large the position should be. The math is straightforward; the discipline to apply it consistently under pressure is the harder part.
The 3-5-7 rule is one framework among several. What matters is having some explicit rule — written down, applied mechanically — rather than making risk decisions in the moment when emotion is highest.
How to Choose the Right Strategy for Your Trading Style
No strategy is universally best. The right one depends on four factors:
Time availability. Scalping and news trading require you to be at the screen, fully focused, for the entire session. Trend trading and pullback strategies can be managed with periodic check-ins — you set your levels, place conditional orders, and monitor rather than react in real time. If you have a job or other commitments during market hours, scalping is the wrong starting point.
Market condition fit. Trending markets (strong directional moves) favor trend, momentum, and breakout strategies. Ranging markets (price oscillating between levels) favor mean reversion and range trading. Applying a trend strategy in a choppy range produces a string of small losses; applying a mean-reversion strategy in a strong trend produces the same. Matching strategy to condition is as important as the strategy itself.
Risk tolerance. Scalping produces many small losses and many small wins — the equity curve is relatively smooth but requires high trade volume to generate meaningful returns. Momentum trading can produce larger individual drawdowns when a momentum move reverses sharply. Trend trading can involve sitting through retracements before the trend resumes. Know which type of loss is psychologically easier to manage.
Experience level. Trend trading and range trading have clearer, more forgiving entry logic — good starting points for traders building their first systematic rules. Scalping and news trading require faster decision-making and tighter execution. If you are new to systematic trading, start with a strategy whose rules you can define precisely before adding complexity.
For traders who do not want to build logic from scratch, ready-made strategies — pre-built rule sets that can be reviewed, tested, and launched — offer a practical starting point before you invest time in custom construction.
Risk Management Rules Every Day Trader Needs
Risk management is not a feature of a good strategy — it is a prerequisite. These rules apply regardless of which approach you trade.
Stop-loss is mandatory, not optional. A stop-loss placed at entry is not a suggestion to exit if things go wrong. It is the rule. Removing or moving a stop during a losing trade is the single most common way traders turn a small, manageable loss into an account-damaging one.
Position sizing relative to account size determines survival across losing streaks. The 3-5-7 framework above gives one structure; the underlying principle is that no single trade should be large enough to materially damage your ability to keep trading.
Daily loss limits define when to stop for the day. A common approach: if you lose beyond a pre-set threshold in a single session, close everything and stop trading. Markets will be there tomorrow. Chasing losses intraday is one of the clearest patterns in how traders damage accounts.
ATR (Average True Range) is a practical indicator for stop placement. ATR measures how much an asset typically moves over a given period — placing a stop at a multiple of ATR below entry accounts for normal volatility without being so tight that random noise triggers the exit. The appropriate multiple depends on the strategy and asset.
The psychological problem with discretionary risk decisions is that they happen under pressure, when losses are already accumulating and the temptation to "give it more room" is strongest. Encoding risk rules into your strategy definition — specific stop levels, position size formulas, daily loss caps — removes the in-the-moment decision entirely. The rule executes; you do not have to choose.
How to Test a Day Trading Strategy Before Going Live
Backtesting means running your strategy rules against historical price data — OHLCV data (Open, High, Low, Close, Volume) — to see how those rules would have performed in the past. It is the essential step between understanding a strategy and trusting it with real capital.
What backtesting validates:
- Win rate — what percentage of trades were profitable
- Average risk/reward — how much the average winner returned relative to the average loser
- Maximum drawdown — the largest peak-to-trough loss during the test period
- Number of trades — whether the strategy generates enough signals to be statistically meaningful
Common pitfalls undermine backtests that look good on paper. Overfitting means tuning parameters so precisely to historical data that the strategy works on that data and nothing else — it will fail on new data. Look-ahead bias means accidentally using information that would not have been available at the time of the trade. Ignoring slippage and fees produces results that are impossible to replicate in live trading, especially for scalping strategies where transaction costs are a significant fraction of the edge.
Paper trading (forward testing) is different from backtesting: you run the strategy in real time without real money, testing execution quality and your own discipline rather than historical performance. Both are useful; neither replaces the other.
Visual backtesting adds a layer of clarity that raw performance tables cannot. When you can see exactly where your rules triggered on the chart — which candle fired the entry, where the stop was placed, where the exit executed — ambiguity disappears. You can spot immediately whether the strategy is entering on the right signals or catching noise.
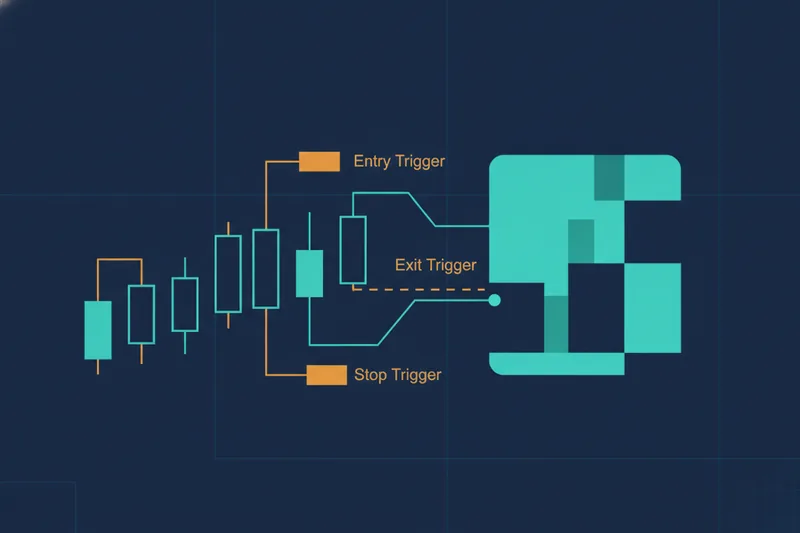
A no-code visual builder like Quberas lets you define your conditions, run historical tests, and compare strategy variations without writing a single line of code. The core workflow — build your logic, visualize it on the chart, backtest against historical data, then launch — compresses what used to require programming knowledge into a process any systematic trader can manage.
From Manual Strategy to Automated Bot: The Next Step
Understanding a strategy and executing it consistently are two different problems. Manual execution of a rule-based strategy still introduces discretionary error: you hesitate on an entry because the last trade lost, you move a stop because the position is close to your level, you skip an exit because you think it will go further. The rules exist; you just do not follow them perfectly under pressure.
An automated trading bot monitors your defined conditions continuously, triggers entries and exits when those conditions are met, and applies your risk rules — without hesitation, without emotional override, and without missing a signal because you stepped away from the screen.
The transparency problem with most automation is that it operates as a black box: the bot trades, but you cannot see why. The visual deal map approach solves this. Instead of parameters buried in a configuration file, your strategy is laid out as connected stages — entry conditions, averaging orders, exit logic, stop-loss rules — visible as a structured map you can read and audit. You know exactly what the bot will do before it does it.
The visual debugger extends this further: when a trade triggers (or fails to trigger), you can see the exact chart zones tied to each condition, identify whether a condition was close to firing or nowhere near it, and adjust thresholds with precision rather than guesswork.
For traders who are not ready to build logic from scratch, starting with a ready-made strategy — reviewing its rules, backtesting it on your chosen market, and launching it — is a practical first step. Building your own comes next, once you understand what well-defined rules actually look like in practice.
Ready to turn your strategy rules into a working bot? Build, backtest, and launch your first automated day trading strategy on Quberas — no code required.