Grid Bots Explained: How Grid Trading Works | Quberas
Grid bots are automated trading programs that place a ladder of buy and sell orders across a defined price range, profiting from repeated small price oscillations — no manual execution required. If you've been trying to figure out whether they actually work, what conditions favor them, and how to configure one without touching a line of code, this guide covers all of it.
What Are Grid Bots?
A grid trading bot is a form of crypto trading automation that executes a systematic buy-low, sell-high loop within a bounded price range. Instead of predicting market direction, it exploits natural price oscillation by pre-placing orders at fixed intervals — called grid levels — above and below the current price.
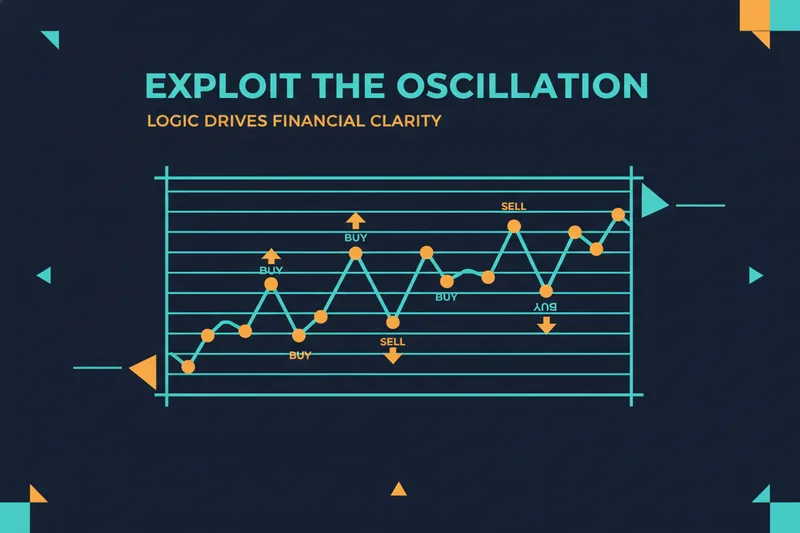
Here's the core distinction from manual trading: a human trader watching a ranging market might catch two or three swings in a session. A grid bot is designed to act on every oscillation, without hesitation or fatigue. The bot doesn't need a view on where price is going — it just needs price to keep moving within the range you've defined.
Grid bots are widely used in markets that frequently exhibit sideways, oscillating price action — the exact conditions the strategy is built for.
How Grid Bots Work: The Underlying Mechanism
The mechanical logic is straightforward once you see it laid out.
Setting the Price Range and Grid Levels
You define an upper price boundary and a lower price boundary — the range within which you expect the asset to trade. The bot then divides that range into evenly spaced intervals: the grid levels.
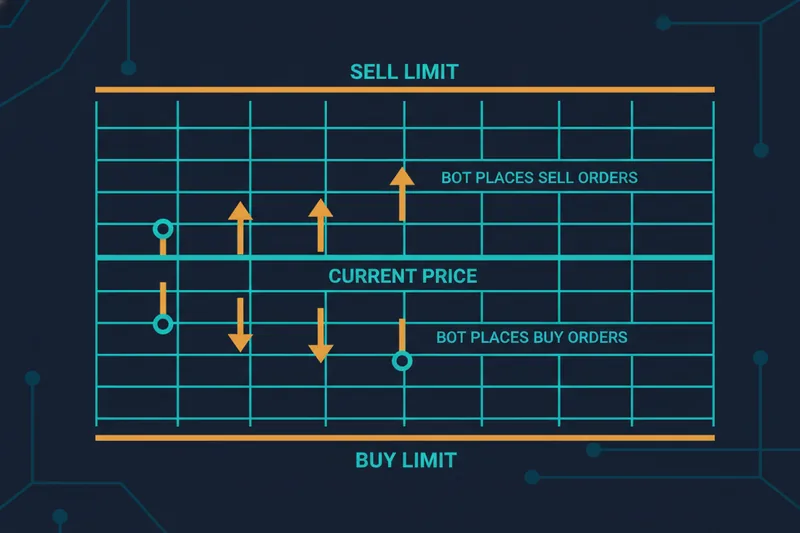
If an asset is trading near the midpoint of your range and you set 10 grid levels, the bot places buy orders below the current price and sell orders above it, each separated by an equal price interval. The number of levels determines how granular the grid is. More levels mean smaller gaps between orders and smaller profit per trade, but more frequent fills. Fewer levels mean wider gaps, larger profit per fill, but less frequent execution.
How Each Grid Level Generates a Profit
This is the profit per grid mechanism — the core of how the strategy generates returns.
When price drops to a buy order, the bot fills it and places a corresponding sell order one grid level above. When price rises back to that sell level, the bot fills it, captures the spread as profit, and resets — placing a new buy order at the original level. Trading fees apply to each fill and reduce the net gain per cycle, so the profit per grid must be sized to remain positive after costs.
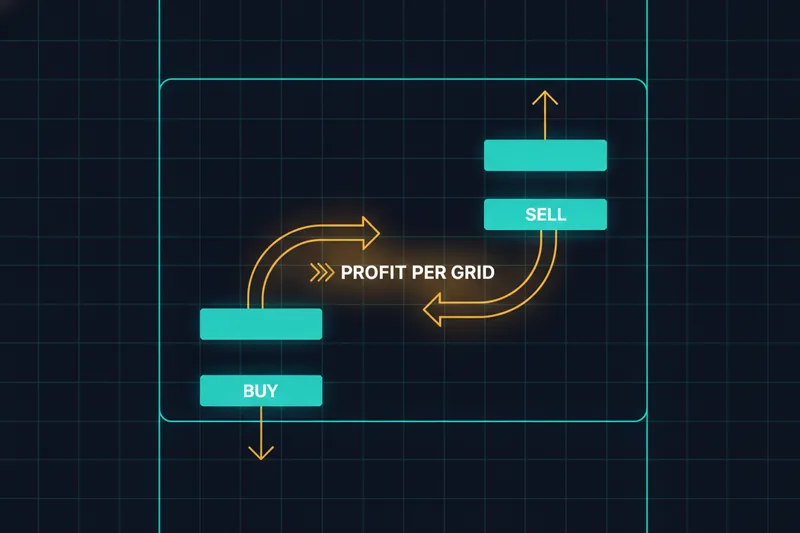
This buy low sell high automation loop repeats continuously. Each completed buy-sell cycle captures the price difference between adjacent grid levels, with fees reducing the net return. The bot doesn't need a sustained trend — it just needs price to oscillate. Every round trip through a grid level is a closed profit.
Grid Bot Strategy: What Market Conditions It's Built For
Grid bots are purpose-built for ranging markets — periods when price moves sideways within a defined band rather than trending strongly in one direction.
In a ranging market, price repeatedly bounces between support and resistance. A grid bot is well suited to this: it sells into every minor rally and buys every minor dip, accumulating small profits over time. Higher volatility within the range is generally beneficial — more oscillation means more grid levels get hit, more cycles complete, and more profit per unit of time.
The problem is trending markets. If price breaks decisively upward through your upper boundary, the bot's sell orders have been filling into the rally, reducing the position held — while the asset continues to appreciate beyond the defined range. If price breaks downward through the lower boundary, the bot's buy orders have been filling on the way down, building exposure at progressively lower prices. In either case, the bot is no longer cycling profitably; it's sitting with an unbalanced position outside its operating range.
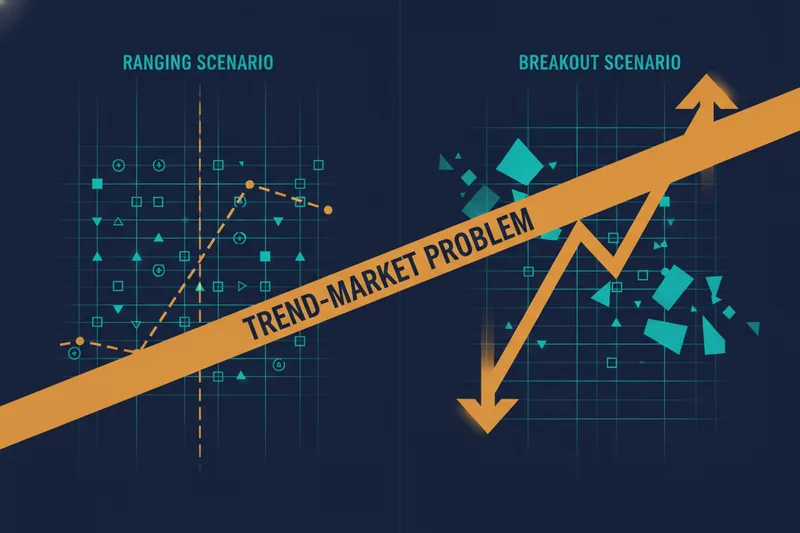
This is the fundamental trade-off: a grid strategy profits from oscillation, not direction. A trend-following bot does the opposite — it rides directional momentum and struggles in choppy, sideways conditions where a grid bot thrives. Knowing which regime you're in before deploying is the most important decision you'll make.
Pros and Cons of Grid Bots
Why Grid Bots Get a Bad Reputation
The skepticism you'll find in trading communities — Reddit threads, Discord servers — usually comes from traders who deployed grid bots in trending markets or without backtesting their range assumptions.
The real disadvantages:
- Underperforms in strong trends. A sustained directional move is the grid bot's worst enemy. When price leaves the defined range, the bot stops cycling and the position becomes unbalanced.
- Capital is tied up across all grid levels. Each buy order requires reserved capital. A wide grid with many levels locks up significant funds that can't be deployed elsewhere.
- Range selection is a skill. Setting the wrong upper or lower boundary — too tight, too wide, or in the wrong price zone — directly determines whether the strategy works. This isn't plug-and-play.
- Price breakout risk. If price exits your defined range, the bot stops cycling and you're left with an unbalanced position.
The profitability debate is real: grid bots are not universally profitable. They are conditionally profitable — and the condition is a ranging market with sufficient volatility.
When They Are Consistently Profitable
Grid bots tend to perform well when:
- The asset is in a confirmed sideways range with clear support and resistance
- Volatility is high enough that price oscillates through multiple grid levels regularly
- Exchange fees are low relative to the profit per grid (fee drag is a real cost)
- The strategy is backtested against historical data before going live — not deployed on assumptions
Backtesting is non-negotiable. Running a grid configuration against historical price data tells you how many cycles would have completed, what the drawdown looked like when price approached the boundaries, and whether your profit per grid actually covers fees. Skipping this step is the most common reason traders conclude grid bots "don't work."
Grid Bots vs Other Trading Bot Strategies
Understanding where grid bots sit relative to other automated strategies helps you choose the right tool for your goals. The following comparisons cover three common bot types traders frequently weigh against grid bots — not an exhaustive list of every automation approach.
Grid bot vs DCA bot: A DCA (dollar-cost averaging) bot buys a fixed asset at regular intervals regardless of price, reducing average entry cost over time. It's a directional, accumulation strategy — you're betting the asset goes up long-term. A grid bot is market-neutral within its range; it profits from oscillation in either direction. DCA suits long-term holders; grid bots suit active range traders.
Grid bot vs trend-following bot: A trend-following bot enters positions based on directional momentum signals. It thrives in trending markets and struggles in chop. A grid bot is the inverse: it thrives in chop and gets hurt by trends. These two strategies are natural complements, not substitutes.
Grid bot vs arbitrage bot: An arbitrage bot exploits price differences for the same asset across different markets simultaneously. The infrastructure and access requirements differ significantly from grid trading, making the two strategies suited to very different trader profiles and operational setups.
The key differentiator: grid bots profit from oscillation, not direction. If you can't identify whether the market is ranging or trending, no bot type will save you — but a grid bot at least removes the emotional execution problem from the equation.
When to Use a Grid Bot: Choosing the Right Setup
Practical criteria for deciding when a grid bot is the right tool:
Identify ranging price action first. Look for an asset that has been consolidating between clear support and resistance levels for a meaningful period. Price should be making lower highs and higher lows within a band — not making new highs or new lows. Avoid deploying a grid bot immediately after a major breakout or breakdown.
Asset liquidity and volatility matter. High-liquidity assets ensure your orders fill without significant slippage. You also need enough intraday volatility that price actually oscillates through your grid levels — a flat, low-volume market won't generate enough cycles to cover fees.
Grid width and number of levels: Wider grids with fewer levels suit lower-volatility assets; tighter grids with more levels suit higher-volatility assets. The right configuration depends on the specific asset and historical price behavior — validate through backtesting rather than assuming a fixed formula applies.
Capital allocation per grid level: Divide your total allocated capital by the number of buy-side grid levels. Each level needs enough capital to fill a meaningful order. Spreading too thin across too many levels increases fee drag relative to profit per grid.
Entry and exit conditions for the overall strategy: Define when you'll turn the bot on (e.g., price is within the range and volatility is above a threshold) and when you'll shut it down (e.g., price closes outside the range on a daily candle). These meta-conditions are as important as the grid configuration itself.
How to Set Up a Grid Bot Without Writing Code
This is where a no-code trading bot builder changes the workflow entirely. Here's how to configure a grid strategy using Quberas's visual interface.
Step 1: Define Your Price Range and Grid Levels
Open the Quberas deal map — the drag-and-drop interface where your strategy's structure lives visually. Set your upper and lower price boundaries directly on the chart. The deal map lets you see the range overlaid on historical price action, so you can immediately judge whether your boundaries make sense relative to actual support and resistance levels.
Set the number of grid levels. The platform spaces them evenly within your range and shows you the resulting order placement visually — no spreadsheet math required.
Step 2: Set Entry and Exit Conditions
Use the condition builder to define when the bot activates and when it stops. This is a puzzle-style interface that supports nested logic: price conditions, indicator crossovers, volume thresholds. For a grid bot, a typical entry condition might be: price is within the defined range AND a volatility indicator confirms sufficient oscillation. Exit conditions define when the bot pauses or closes all positions — for example, if price closes below your lower boundary.
Step 3: Backtest and Review Triggers on the Chart
Before risking capital, run the backtest. The visual debugger highlights on the chart exactly where each condition triggered historically — which grid levels filled, where the bot cycled, and where price broke out of range. This isn't a summary report; you can see the logic executing trade by trade on the price chart. If the backtest reveals the range was too tight or fees ate the profit, adjust and re-run.

Step 4: Launch Your Grid Bot
Once the backtest results are acceptable, deploy the bot live. The same visual interface that showed you the backtest triggers now shows you live execution — you can see in real time which grid levels are active, which orders are pending, and where the bot is in its cycle.
Frequently Asked Questions About Grid Bots
Are grid bots profitable? Conditionally, yes. In ranging markets with sufficient volatility and properly configured grid levels, they can generate consistent small profits that compound over time. In trending markets, they tend to underperform or produce losses. Profitability depends heavily on market condition selection and backtesting.
What is a good profit per grid? This varies by asset, exchange fees, and grid width. The minimum viable profit per grid must exceed the round-trip trading fee for each cycle. Wider grids produce higher profit per cycle but fewer fills; tighter grids produce more fills but smaller margins. Backtesting your specific configuration against historical data is the only reliable way to validate this.
Do grid bots work in a bear market? In a sustained downtrend, a standard grid bot's buy orders fill as price falls, building exposure at progressively lower prices — which can result in significant unrealized losses if price doesn't recover within the range. Standard grid bots are not designed for strong directional moves in either direction.
How many grid levels should I use? There's no universal answer. More levels mean more frequent trades and lower profit per trade; fewer levels mean the opposite. The right number depends on your asset's volatility, your total capital, and the width of your range — all of which should be validated through a backtest before going live.
Can I backtest a grid bot before risking real money? Yes — and you should. Backtesting a grid strategy against historical price data shows you how the configuration would have performed, where it struggled, and whether the profit per grid is realistic given fees. Deploying without backtesting is the most common avoidable mistake in grid bot trading.
Ready to build and backtest your own grid bot without writing code? Try Quberas's visual strategy builder and see exactly where your rules trigger — directly on the chart.