Trading Strategies Explained: Build & Backtest
A trading strategy is a fixed set of rules that tells you when to enter a market, when to exit, and when to cut losses — removed from gut feeling and applied the same way every time. Below you'll find the main strategy types, how to match one to your own constraints, how to validate it against historical data before risking money, and how to turn any of these approaches into a working, testable bot without writing a line of code.
What Is a Trading Strategy?
A trading strategy is a defined set of conditions that governs three decisions: when to open a position (entry conditions), when to close it for a profit or because the setup no longer holds (exit conditions), and when to close it to limit damage if the market moves against you (a stop-loss). Everything else — indicators, timeframes, asset choice — exists to serve those three decisions.
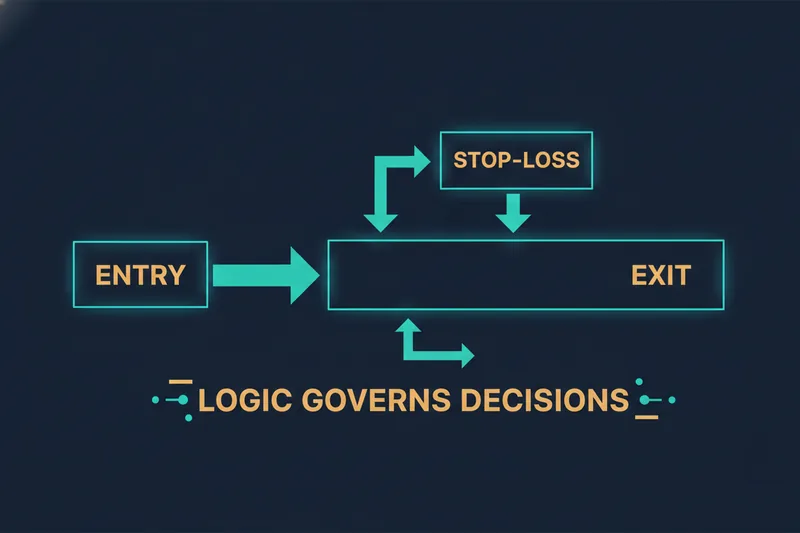
Strategies can be executed manually, where a trader watches charts and pulls the trigger by hand, or automated, where software monitors the same conditions continuously and executes without waiting for a human to notice. Both approaches can follow identical logic; the difference is consistency and speed of execution, not the rules themselves. What matters for either path is that the decision-making is rules-based: the same market condition should produce the same action every time, so the strategy can be tested, measured, and improved rather than re-invented on every trade.
Types of Trading Strategies
Most trading approaches fall into a small number of governing categories. Understanding these before drilling into specific setups gives you a mental map for everything that follows.
Trend trading follows the direction an asset is already moving in, entering in the direction of higher highs and higher lows (or the reverse for downtrends) and staying in the trade as long as that direction holds.
Range trading assumes price is bouncing between a defined support and resistance level rather than trending, buying near the floor and selling near the ceiling.
Breakout trading enters when price moves decisively outside a prior range or consolidation zone, on the assumption that the move will continue once the barrier is cleared.
Reversal trading bets against the current direction, entering at a point where a trend or range shows signs of exhausting and turning the other way.
Momentum trading enters in the direction of a strong, accelerating price move, aiming to capture the middle of a fast run rather than its beginning or exact end.
Arbitrage trading exploits a price difference for the same or equivalent asset across two venues, buying where it's cheaper and selling where it's more expensive, with the profit coming from the spread rather than a directional market view.
Pairs trading takes offsetting positions in two correlated assets — long one, short the other — profiting when their price relationship reverts to its historical norm regardless of overall market direction.
Day Trading Strategies
Intraday trading — where positions rarely last more than a session — draws on the same governing categories above, applied on shorter timeframes. Two common approaches illustrate how that compression changes the logic: scalping and intraday momentum trading.
Scalping targets very small, fast price moves, typically on charts ranging from 1-minute to 15-minute intervals, with trades held for seconds or minutes rather than hours. Because holding periods are so short, outcomes are shaped more by execution speed and spread than by any large market move — which makes precise entry and exit rules more important here than in almost any other strategy type.
Intraday momentum trading looks for bursts of directional strength within a single session — often around news events or the open — and combines this with intraday breakout setups: entering when price clears a session high or low with volume behind it, then exiting before momentum fades rather than holding overnight.
Swing Trading Strategies
Swing trading stretches the trend-following and reversal logic already covered across a multi-day to multi-week holding period instead of an intraday one. A trend-following swing trade enters on a pullback within an established multi-day trend and holds until the trend shows clear signs of ending. A reversal-based swing entry, by contrast, waits for a multi-day trend to show exhaustion — momentum divergence, a failed retest of a high or low — and positions for the turn, holding through the following days or weeks as the new direction develops. The core difference from day trading isn't the logic itself, but the timeframe the same rules are applied to.
Manual Charting vs. Visual, No-Code Automation
Running any of the strategies above manually means sitting at a chart, watching for the same conditions repeatedly, and executing by hand — which works, but doesn't scale past a handful of setups and is vulnerable to fatigue, hesitation, and missed entries during volatile sessions.
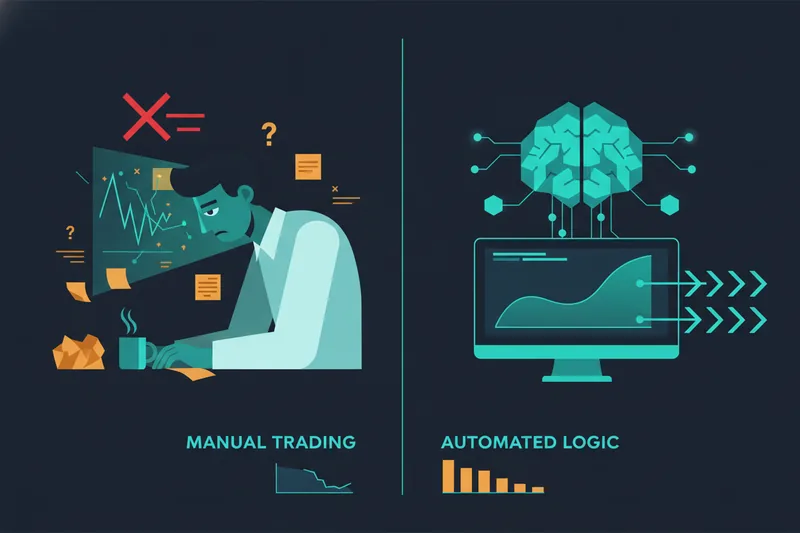
The traditional automated alternative is a hand-coded bot: a script that encodes entry, exit, and stop-loss logic in a programming language. This solves the consistency problem but introduces a new one — the logic lives in code, so verifying exactly why a trade did or didn't trigger means reading through conditionals rather than looking at a chart.
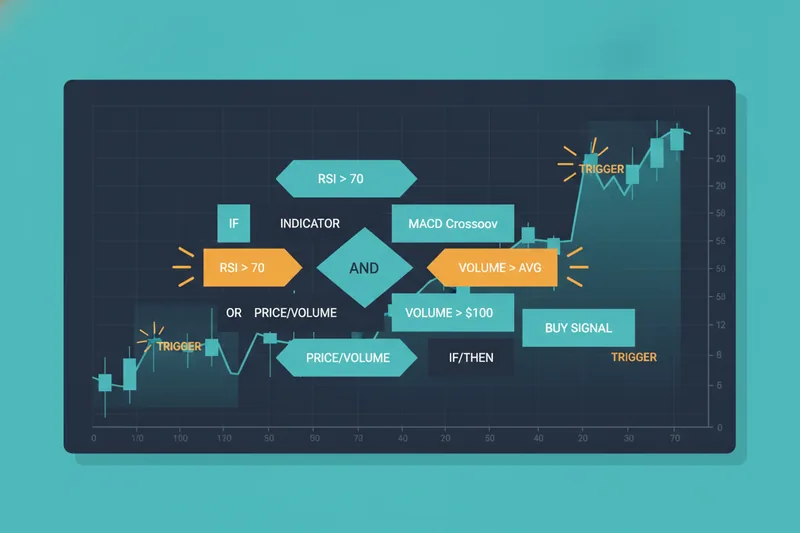
A visual condition builder addresses this directly by letting you assemble entry, averaging, exit, and stop-loss rules from indicators, price, and volume conditions on a canvas, then rendering exactly where those rules are true or false directly on the chart — no reading code to understand the logic. The full structure of a strategy expressed this way — its entry, its averaging steps, its exits, its stop-loss — is often called a deal map: a visual layout of every stage a trade can move through and how they connect.
How to Choose a Trading Strategy
Matching a strategy type to your own situation comes down to four constraints:
- Risk tolerance — reversal and breakout strategies tend to produce more false starts than trend-following, since you're betting against or ahead of the prevailing move.
- Time available for monitoring — scalping and intraday momentum demand near-constant attention; swing and trend strategies can be checked once or twice a day.
- Market or asset chosen — range and pairs strategies need an asset that oscillates or holds a stable relationship with another; trend and breakout strategies need one prone to sustained directional moves.
- Capital size — arbitrage and pairs trading typically require enough capital to hold two offsetting positions at once and still clear costs on a thin spread.
There's no universally "best" strategy type — only one that fits your risk appetite, available time, chosen market, and account size at the same time.
How to Backtest a Trading Strategy
Backtesting means running a strategy's rules against historical price data to see how it would have performed, before committing real capital to it. It's the difference between assuming a rule works and having evidence it did, over a specific period and asset.
Two levels of historical data matter here. OHLCV data — open, high, low, close, and volume per candle — is enough to validate most trend, range, breakout, and swing strategies. Strategies sensitive to execution quality, like scalping, benefit from order-book data — the record of live buy and sell orders at each price level — or bid/ask data, since a strategy can look profitable on candle closes alone and still lose money once spread and slippage are accounted for.

Backtesting isn't the final checkpoint, either — a strategy generally also needs forward testing, running it on live, unseen market data without committing real money, before it's considered ready for real capital. When comparing multiple variations of a strategy, a Sharpe ratio — a measure of return relative to volatility — above 1.0 is considered acceptable, above 2.0 is very good, and above 3.0 is excellent.
Risk Management in Trading Strategies
Risk controls apply at two levels: the individual trade and the overall system.
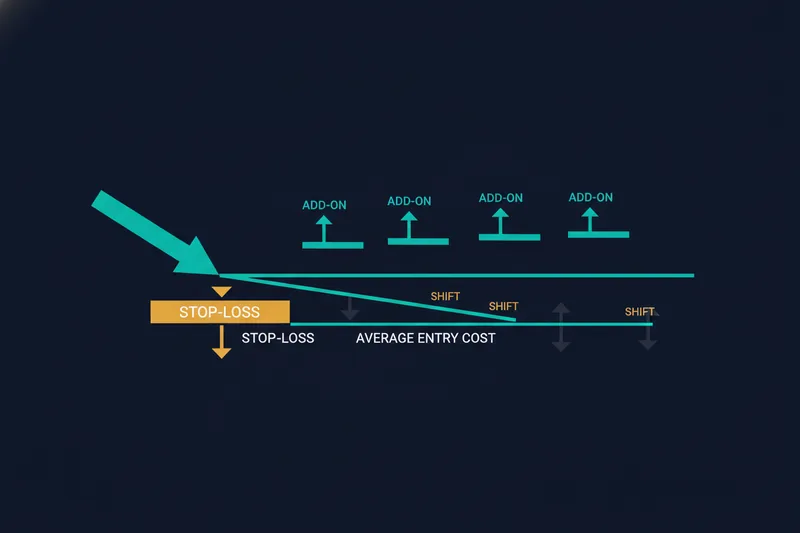
At the trade level, stop-loss placement defines your maximum acceptable loss before a position is closed automatically. Averaging orders add to a position at progressively worse prices to lower your average entry cost — distinct from a DCA (dollar-cost-averaging) bot, which buys or sells at fixed time intervals on a schedule rather than adding to a position based on price. Position sizing — how much capital goes into any single trade — determines how much a single loss can affect your account regardless of where the stop is set.
At the system level, one structured framework worth knowing is the 3-5-7 rule: cap risk on any single trade at 3% of capital, cap total risk across all simultaneously open positions at 5%, and require a minimum profit-to-loss ratio of 7% on winning trades relative to losers. Beyond per-trade limits, imposing a loss limit — a maximum drawdown that pauses trading — and a cooldown period after a stop-loss hit helps prevent a losing streak from compounding through revenge trading.
Trading Strategies for Beginners
If you're new to systematic trading, start with strategy types that have fewer moving parts: trend trading and range trading, since both rely on a small number of clearly observable conditions rather than the precise timing that breakout or reversal setups demand.
You don't have to build your first strategy from a blank canvas, either. Starting from a ready-made strategy — one already built and tested by someone else — lets you see a working rule set in action, set your own risk parameters around it, and run it before you've written a single condition yourself. From there, customize gradually: adjust one threshold or swap one indicator at a time, backtest the change, and keep what improves results. This is far more reliable than trying to design a complete rule set from scratch on day one.
Building and Launching Your Strategy Without Code
Every strategy type above — trend, range, breakout, reversal, momentum, arbitrage, pairs, scalping, swing — reduces to the same underlying components: entry conditions, optional averaging, exit conditions, and a stop-loss. In Quberas, you build that structure as a deal map, connecting each stage visually rather than describing it in code.
The conditions themselves come from a puzzle-style condition builder, where you combine price levels, indicators, volume, and crossovers into nested logic — "if this indicator crosses this level and volume exceeds this threshold" — without touching a syntax rule. Once built, a visual debugger highlights the exact chart zones tied to each condition, including how close a condition came to triggering versus where it actually fired, so you can see whether a rule is too tight, too loose, or catching noise instead of real signal.
From there, run the strategy through a backtest against historical data before it ever touches live capital, and compare variations the same way described above. If it performs the way you intended, you can publish it to a strategy marketplace — sharing it publicly or restricting it to a private link — rather than keeping the work to yourself.
Ready to see one of these strategies in action? Build it visually as a deal map in Quberas, backtest it against historical data, and watch exactly where it would have triggered — no code required.