Nasdaq Futures Live (NQ): Read & Act on Signals
Nasdaq 100 E-mini Futures (NQ) are the most-watched pre-market signal in equity trading — but a price widget alone tells you nothing. This guide explains what the live NQ quote actually means, what drives it up or down, and how to translate those signals into an automated trading strategy without writing a single line of code.
What Are Nasdaq 100 Futures (NQ)?
Nasdaq 100 E-mini Futures (NQ) are standardized derivative contracts that track the Nasdaq 100 Index and trade on the CME Group's Globex electronic exchange. Each contract obligates the buyer or seller to transact the index's value at a specified future date — but in practice, most retail traders use them to speculate on direction or hedge equity exposure, not to take delivery of anything.
The critical distinction: NQ futures are not the Nasdaq 100 Index itself. The Nasdaq 100 Index (NDX) is a cash index — a weighted average of 100 of the largest non-financial companies listed on the Nasdaq exchange, calculated during market hours. NQ futures, by contrast, trade nearly around the clock on Globex, which is precisely why they matter so much as a pre-market signal.
NQ vs. the Nasdaq 100 Index: What's the Difference?
The NDX is a snapshot of spot prices during the regular session (9:30 AM–4:00 PM ET). NQ futures incorporate market expectations, interest rates, dividends, and time-to-expiry into their price — a relationship called the basis (the difference between the futures price and the spot index level). When futures trade at a premium to the index, that's called contango; at a discount, backwardation. For most short-term traders, the basis is small enough to treat NQ as a near-equivalent to NDX direction.
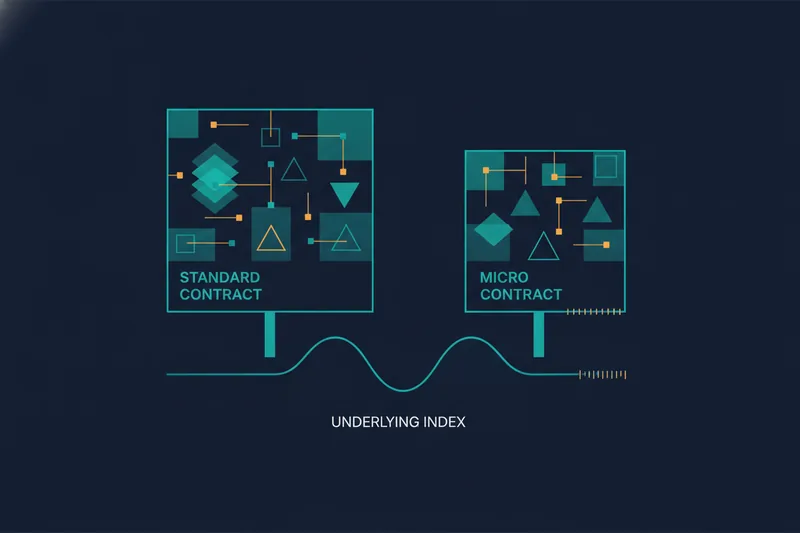
E-mini vs. Micro E-mini (MNQ): Contract Sizes at a Glance
| Contract | Ticker | Multiplier | Tick Size | Tick Value |
|---|---|---|---|---|
| E-mini Nasdaq 100 | NQ | $20 × index | 0.25 points | $5.00 |
| Micro E-mini Nasdaq 100 | MNQ | $2 × index | 0.25 points | $0.50 |
The Micro E-mini Nasdaq 100 (MNQ) is one-tenth the size of the standard NQ contract, making it accessible to retail traders with smaller accounts. Both trade on Globex under the same session hours and follow the same underlying index.
Futures contract expiration follows a quarterly cycle — March, June, September, and December. The nearest expiry is called the front-month contract and carries the most liquidity. As expiry approaches, traders roll their positions to the next quarter.
Nasdaq Futures Live Price & Chart
For a live NQ futures quote, the most reliable free sources are TradingView (ticker: NQ1! for the continuous front-month contract) and the CME Group website, which publishes official settlement prices and volume data. TradingView's chart updates in real time during Globex hours and lets you overlay indicators directly on the NQ price feed.
Where to Find a Reliable NQ Futures Live Chart
- TradingView — search
NQ1!(continuous) or the specific expiry, e.g.,NQU2025for the September 2025 contract. Free accounts have a short data delay; a paid plan gives true real-time. - CME Group (cmegroup.com) — official contract specs, settlement prices, and volume.
- Your broker's platform — if you're approved for futures trading, your broker feed is typically the most accurate for execution purposes.
Key Data Fields on a Futures Quote Explained
Every NQ quote shows the same core fields. Know what each one is telling you:
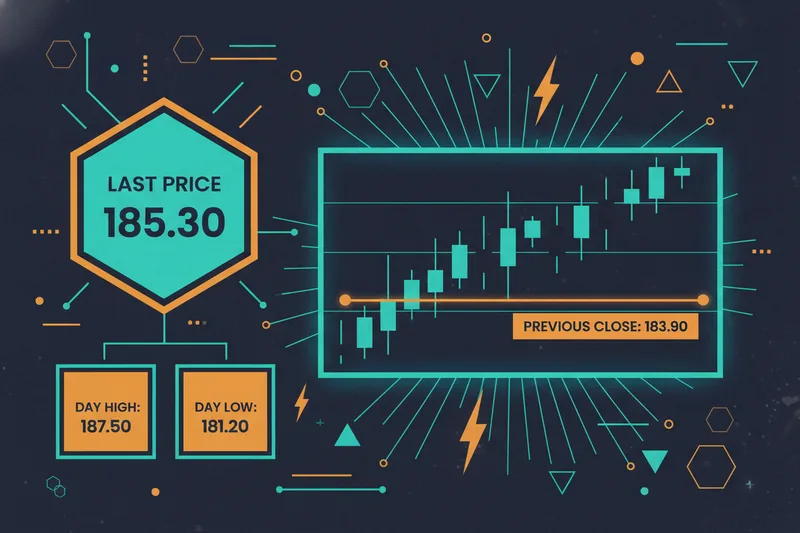
- Last price — the most recent transaction price on Globex.
- Day high / day low — the range traded within the current Globex session (which starts Sunday evening, not at 9:30 AM ET).
- Prev close — the prior session's settlement price, used to calculate the change figure.
- Change (points / %) — how far price has moved from the previous settlement.
- Volume — total contracts traded in the current session; a signal of conviction behind a move.
- Contract expiration label — confirms which quarterly contract you're looking at (e.g., "Sep '25").
Quberas can backtest strategy rules against historical NQ OHLCV data (Open, High, Low, Close, Volume) — the same data fields you see on a live quote — so the signals you learn to read here map directly to the data your automated rules will run on.
How to Read a Nasdaq Futures Quote
Seeing "NQ +85 points" means nothing without context. Here's how to extract actionable meaning from each field.
What Does the Change (Points / %) Actually Mean?
The change figure is always relative to the previous settlement price (prev close), not the prior calendar day's close. Because Globex runs nearly 24 hours, a large overnight move can already be priced in before most traders wake up.
Fair value is the theoretical price at which NQ futures should trade relative to the cash Nasdaq 100 index, accounting for interest rates and expected dividends. Financial networks often quote "futures vs. fair value" before the open — if NQ is trading 50 points above fair value, the cash market is expected to open higher. If it's below fair value, expect a lower open.
Gap-up / gap-down refers to when the futures price at the cash open is meaningfully above or below the prior day's cash close. Gaps don't always fill, but statistically, the behavior of a gap in the first 30 minutes of the regular session is one of the most-watched setups in index futures trading.
Volume and Open Interest: Reading Market Conviction
Trading volume measures how many contracts changed hands in a session. A 100-point NQ rally on thin volume is far less meaningful than the same move on volume that's 50% above the 20-day average — the latter suggests institutional participation.
Open interest is the total number of outstanding contracts that haven't been settled or closed. Rising open interest alongside a price move suggests new money entering the trend. Falling open interest during a move suggests existing positions are being closed — a potential warning that the move is exhausting.
For corroboration, always check S&P 500 futures (ES). When NQ and ES are moving in the same direction with similar conviction, the signal is stronger. When they diverge — tech selling off while the broader market holds — that's a sector-specific story worth investigating before acting.
Nasdaq Futures Trading Hours
NQ futures trade on CME Globex in a near-24-hour session, Sunday through Friday. Understanding the schedule is essential for both manual interpretation and automated strategy timing.
Pre-Market vs. Regular Session: Which Signals Matter More?
| Session | ET Hours | Notes |
|---|---|---|
| Globex open (Sunday) | 6:00 PM ET Sunday | Week begins |
| Pre-market (weekdays) | 6:00 PM – 9:30 AM ET | Includes overnight |
| Regular session overlap | 9:30 AM – 4:00 PM ET | Cash market open; highest liquidity |
| After-hours | 4:00 PM – 5:00 PM ET | Lower liquidity |
| Daily maintenance | 5:00 PM – 6:00 PM ET | No trading |
Pre-market trading hours (roughly 6:00 PM to 9:30 AM ET) are when NQ futures absorb overnight news — earnings releases, economic data from Asia and Europe, geopolitical events, and Fed commentary. This is the window most traders watch for directional bias.
The regular session (9:30 AM–4:00 PM ET) is when the Nasdaq cash market is open and liquidity is highest. Price discovery is most efficient here, and volume spikes are most meaningful.
Overnight NQ Moves: What They Tell You Before the Open
An overnight move of 0.5% or less is often noise — thin liquidity amplifies small order flows. A move of 1%+ on elevated volume, particularly after a specific catalyst (earnings from a mega-cap component, a Fed statement), carries more weight. The key question is always: what drove it, and is that driver sustained?
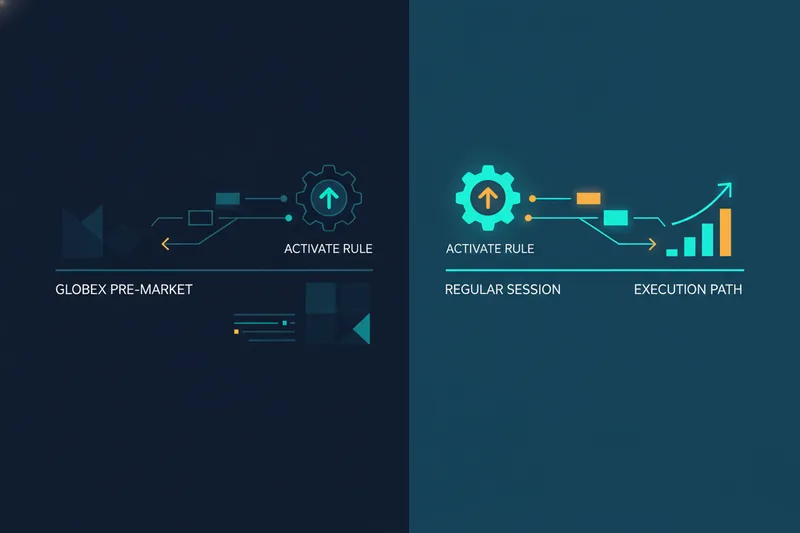
For automated strategies, the session window matters. A rule designed to trade pre-market gaps needs to be scheduled to run during Globex pre-market hours, not the regular session — a distinction that's easy to configure in a visual strategy builder but easy to overlook when setting parameters manually.
Why Are Nasdaq Futures Up or Down Today?
NQ futures move for reasons that range from scheduled macro events to a single earnings report from a trillion-dollar company. Knowing the category of driver helps you assess whether a move is likely to persist.
Macro Catalysts: Fed, CPI, and Earnings
The three biggest systematic drivers of NQ futures:
- Federal Reserve decisions and commentary — Rate expectations directly affect the valuation of growth stocks, which dominate the Nasdaq 100. A hawkish surprise (rates higher for longer) typically pressures NQ; a dovish pivot rallies it.
- CPI, jobs data, and other economic releases — Inflation data shifts rate expectations, which moves NQ. Non-farm payrolls, PCE, and GDP revisions all move the needle.
- Earnings from mega-cap Nasdaq 100 components — Apple (AAPL), Microsoft (MSFT), Nvidia (NVDA), Amazon (AMZN), and Meta (META) collectively represent a large share of the index's weight. A single earnings miss from Nvidia after hours can move NQ futures 2–3% overnight.
Gap-Up and Gap-Down: How to Interpret Pre-Market Direction
A gap-up occurs when NQ futures open the regular session above the prior cash close; a gap-down is the reverse. The size and context of the gap matter:
- Small gaps (< 0.3%) on no specific catalyst tend to fill during the first hour of trading.
- Large gaps (> 0.75%) driven by a specific catalyst — a major earnings beat, a Fed announcement — are more likely to hold direction, at least initially.
- Volume at the open is the confirmation signal. A gap-up that immediately attracts buying volume is more likely to extend than one that opens on thin air.
When Pre-Market Moves Are Reliable vs. Noise
Pre-market NQ moves are most reliable when: (a) they're driven by a specific, identifiable catalyst; (b) volume is above the pre-market average; and (c) ES futures are confirming the same direction. They're most likely noise when: volume is thin, no catalyst is identifiable, and the move reverses within 30 minutes of the cash open.
How to Build an Automated NQ Futures Strategy Without Code
Reading NQ signals is one thing. Acting on them consistently — without hesitation, without emotional override — requires a systematic approach. Here's how the signals covered above translate into automated strategy logic.
Mapping a Futures Signal to a Visual Entry Condition
Take a concrete example: you've observed that when NQ futures gap up more than 0.5% pre-market on above-average volume, the first 15-minute candle after the cash open tends to continue in the gap's direction. That's a tradeable hypothesis — but only if you can define it precisely and test it.
In Quberas's no-code visual strategy builder, you'd express this as a set of entry conditions in the deal map — the visual interface that maps out every stage of a trade: entry trigger, averaging orders, exit, and stop-loss. The condition builder lets you combine price-level crossovers, volume thresholds, and time-window filters using a puzzle-style logic interface, without writing a single line of code.
The entry condition for the gap example might look like: price > prev_close × 1.005 AND volume > 20-period average volume AND session = regular. Each condition is a visible block; the logic connecting them is explicit on screen.
Backtesting Your NQ Rule on Historical Data
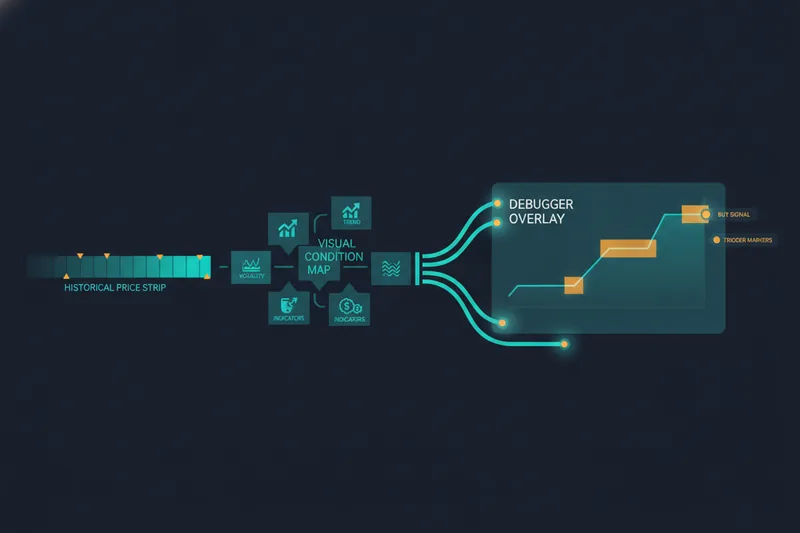
Before risking capital, you validate the rule. Quberas runs backtesting against historical OHLCV data — the same open, high, low, close, volume fields you read on a live NQ quote. The visual debugger highlights the exact chart zones where each condition would have triggered historically, so you can see not just the P&L outcome but why each trade fired. That transparency is what separates a tested rule from a guess.
If a condition triggered 40 times in the backtest but 15 of those were during the daily maintenance window or on anomalous volume days, you'll see it — and you can tighten the filter before going live.
Setting Stop-Loss and Exit Logic for Futures Volatility
NQ futures are volatile. A strategy without a defined stop-loss is not a strategy — it's a position waiting to blow up. In the deal map, stop-loss and exit conditions are defined at the same time as entry, not as an afterthought. You can set a fixed-point stop (e.g., 50 NQ points below entry), a percentage-based stop, or a condition-based exit (e.g., price crosses back below the pre-market level that triggered entry).
Once the backtest validates the rule and the risk parameters are set, launching the strategy live is the final step — the same logic that ran on historical data executes automatically on live market data.
Frequently Asked Questions About Nasdaq Futures
What time do Nasdaq futures open? NQ futures trade on CME Globex nearly 24 hours a day. The weekly session opens at 6:00 PM ET on Sunday and runs continuously (with a daily 1-hour maintenance break from 5:00–6:00 PM ET) through 5:00 PM ET on Friday.
What is the ticker symbol for Nasdaq 100 futures?
The standard E-mini contract is NQ (or /NQ on many platforms). On TradingView, use NQ1! for the continuous front-month chart. The Micro E-mini is MNQ.
Are NDX futures the same as NQ futures? Not exactly. NDX refers to the Nasdaq 100 Index itself (the cash index). NQ is the CME-listed E-mini futures contract that tracks NDX. They move together closely, but NQ trades around the clock while NDX only calculates during the regular cash session.
How do Nasdaq futures affect the stock market open? NQ futures set directional expectations before the 9:30 AM ET cash open. Market makers and institutional traders use the futures price (relative to fair value) to price their opening orders. A strong NQ futures rally pre-market typically translates to a higher open for Nasdaq-listed stocks — though the relationship isn't mechanical.
Can retail traders trade NQ futures? Yes, though standard NQ contracts require meaningful margin (typically $15,000–$20,000+ per contract, depending on the broker). The MNQ (Micro E-mini) was specifically designed to lower the barrier — margin requirements are roughly one-tenth of the standard contract.
What is the difference between NQ and MNQ? Both track the Nasdaq 100 Index. NQ has a $20 multiplier (each full point = $20); MNQ has a $2 multiplier (each full point = $2). MNQ is better suited for smaller accounts or for sizing down risk while learning futures mechanics.
Ready to stop watching NQ futures and start acting on them systematically? Build your first automated Nasdaq futures strategy in Quberas — no code required. Define your entry conditions visually, backtest them against real NQ price history, and launch with confidence.