Fear and Greed Index Crypto: Trade with Rules
The Crypto Fear and Greed Index condenses market emotion into a single number from 0 to 100 — the lower the number, the more fear is driving prices, and the higher it climbs, the more greed is in control. It's built from a mix of volatility, volume, momentum, and sentiment data, and traders use it to gauge whether the market is overreacting in either direction. The problem most traders run into isn't understanding the index — it's translating "Extreme Fear" or "Extreme Greed" into a repeatable rule they can actually test, rather than a number they eyeball before making a gut-feel trade. That's the gap a no-code platform like Quberas is built to close: instead of just watching the score, you can turn a specific reading into a codified, backtested entry or exit condition.
What Is the Crypto Fear and Greed Index?
The Fear and Greed Index is a sentiment gauge that scores crypto market mood on a scale of 0 to 100. It was originally adapted from a similar concept used in traditional equity markets and has become one of the most widely referenced sentiment tools in crypto, largely through Alternative.me, an independent data site that aggregates and publishes the index daily, and through market data aggregators like CoinMarketCap, which also display the score to a wider audience.
The scale splits into five bands: Extreme Fear (typically 0-24), Fear (25-44), Neutral (45-55), Greed (56-75), and Extreme Greed (76-100). At a foundational level, the index exists to answer one question: is the current price action being driven by rational positioning, or by an emotional overreaction that tends to correct? It isn't a price predictor — it's a mood reading, and its real value comes from how it's used once you understand what feeds it.
How the Fear and Greed Index Is Calculated
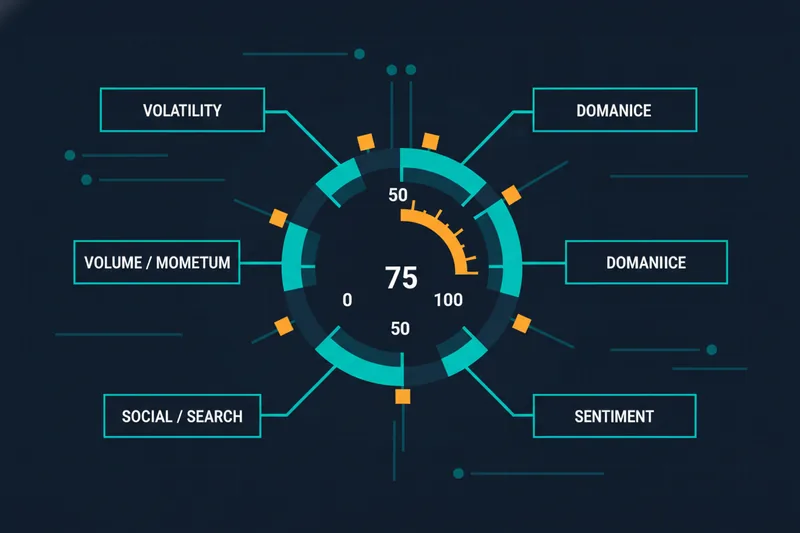
The score is a composite of several inputs, each capturing a different dimension of market behavior rather than relying on price alone.
- Bitcoin price volatility — sharp price swings, especially sudden drawdowns, push the score toward fear, since volatility spikes are historically associated with panic selling.
- Trading volume and momentum — rising volume alongside rising prices tends to signal greed building; falling volume during a decline signals waning conviction.
- Social media sentiment analysis — post volume, engagement rates, and hashtag activity across platforms feed into the emotional read of the market.
- Google Trends / search data — spikes in searches for terms like "Bitcoin crash" or "buy Bitcoin" reflect retail attention shifting toward fear or greed.
- Bitcoin dominance — a rising share of total crypto market cap concentrated in Bitcoin often reflects a flight to relative safety within crypto, which the index treats as a fear signal, while capital rotating into altcoins is read as a greed signal.
Both CoinMarketCap and Alternative.me's methodologies weight these inputs differently and update on their own schedules, which is why you'll occasionally see the two scores diverge by a few points on the same day. Neither source publishes a single definitive formula, so treat the number as a directional signal rather than a precise measurement.
Reading the Scale: From Extreme Fear to Extreme Greed
The five-zone classification is the governing framework for everything that follows. A score of 0-24 (Extreme Fear) generally reflects capitulation-style selling, where traders exit positions regardless of fundamentals. 25-44 (Fear) suggests caution without panic. 45-55 (Neutral) means sentiment isn't pushing prices in either direction. 56-75 (Greed) reflects growing confidence and rising risk appetite. 76-100 (Extreme Greed) typically shows up near euphoric buying, often just before a pullback.
The thresholds themselves matter more than the label. A trader who waits for a score under 20 will act far less often — but with more conviction — than one who treats anything under 40 as a buy signal. That distinction is exactly what separates casual index-watching from a defined, testable rule.
Current Index Value and Historical Trends
The index moves daily, and its real analytical value comes from context: how does today's reading compare to where the market has been before? Historical charts — the kind available through TradingView integration on charting platforms — let you overlay the Fear and Greed score against Bitcoin's price to see how sentiment extremes lined up with market turns.
Looking back, some of the sharpest Extreme Fear readings coincided with major drawdowns — the March 2020 crash and the FTX collapse in late 2022 both pushed the index into single digits. On the other end, Extreme Greed readings above 90 have repeatedly clustered near local price tops. Crypto markets have also historically moved in multi-year cycles rather than short bursts — Bitcoin's cycles from bull-market top to bear-market low have tended to repeat roughly every four years since 2011 — which means a single Extreme Fear reading needs to be read against that longer backdrop, not in isolation.
How to read the historical Fear and Greed chart
Plot the index alongside price on the same timeframe and look for divergence: if price keeps falling but the index stops making new lows, fear may be exhausting itself. Conversely, if price keeps climbing while the index stalls below prior Extreme Greed peaks, momentum may be fading before the chart shows it.
How to Use the Fear and Greed Index for Trading Decisions
Buying fear, selling greed: the contrarian approach
The most common application is a contrarian trading strategy — buying when the crowd is fearful and reducing exposure when it's greedy, on the premise that sentiment extremes tend to overshoot and revert. In practice, this means treating Extreme Fear as a zone to scale into positions, not a signal to panic-sell, and treating Extreme Greed as a zone to take profit or tighten risk rather than chase the move.
Combining sentiment with technical indicators
Sentiment alone is a blunt instrument. Most traders pair a Fear and Greed reading with technical indicators — moving average crossovers, RSI, or volume trends — to confirm that price action agrees with the sentiment extreme before acting. For example, an Extreme Fear reading combined with a bullish moving-average crossover and rising volume gives more conviction than the sentiment score alone. This is where momentum confirmation earns its place: a low score with flat or declining volume may just mean fear is deepening, not bottoming.
Fear and Greed Index vs Other Sentiment Indicators
The Fear and Greed Index isn't the only sentiment tool available, and it shouldn't be treated as a standalone system. On-chain sentiment metrics — such as exchange inflows/outflows or long-term holder behavior — measure actual capital movement rather than inferred mood, and often lag or lead the index depending on the metric. Standalone social media sentiment tools track narrower slices of the same data the index already partially incorporates, so they tend to be more granular but noisier.
Traders coming from equities sometimes compare it to VIX-style volatility indexes, but the comparison only goes so far: the VIX measures implied volatility priced into options, while the crypto index blends volatility with volume, search, and social data into one blended score. Finally, Bitcoin dominance deserves separate attention as its own signal rather than just an input — rising dominance during a fear phase can indicate capital consolidating into Bitcoin rather than leaving the market entirely, which changes how you'd interpret the same Fear and Greed reading.
Limitations and False-Signal Risks
The index has real weaknesses. It's inherently lagging — most of its inputs (volume, volatility, search trends) reflect what already happened rather than what's about to happen, so by the time a reading hits Extreme Fear, part of the move may already be over. It's also prone to false signals: a score can sit in Fear territory for weeks during a slow grind down, and treating every dip below 25 as a buy trigger without confirmation leads to premature entries.
The bigger risk is over-reliance on a single metric. Treating the index as a standalone trading system, rather than one input among several, is the most common mistake among traders systematizing it for the first time. This is exactly why threshold tuning matters — a fixed cutoff like "buy below 20" works differently in a slow bleed than in a sharp capitulation, and refining that threshold against historical data is what separates a rule that holds up from one that only worked once.
Turning the Fear and Greed Index into an Automated No-Code Strategy
Once you understand what moves the index and where it tends to fail, the next step is codifying it — and this is where a no-code strategy builder replaces manual checking with a testable rule.
Setting Fear and Greed thresholds as entry/exit conditions
In Quberas, a Fear and Greed reading can be added as a condition inside a puzzle-style condition builder, nested alongside price, volume, or indicator conditions — for example: "if index < 20 AND price is above the 50-day moving average, open position." Those conditions live inside a deal map, the visual layout of a strategy's entry, averaging, exit, and stop-loss stages, so you can see exactly where an Extreme Fear reading triggers an entry and where an Extreme Greed reading closes it — rather than trusting logic buried in a script.
Backtesting a sentiment-based strategy before going live
Before risking capital, backtesting runs the strategy against historical price and index data to show how it would have performed through past fear and greed cycles, including the sharp ones. This is also where you'd sanity-check performance beyond raw returns — a strategy with a Sharpe ratio above 1.0 is generally considered acceptable, above 2.0 very good, and above 3.0 excellent, which gives a more honest read on risk-adjusted results than total return alone.
Fine-tuning thresholds to reduce false signals
The visual debugger highlights the exact chart zones tied to each condition, including cases where a threshold came close to triggering but didn't — the "almost vs triggered" distinction that shows whether your cutoff is too tight or too loose. If a strategy keeps almost-triggering at 22 but never quite hits your 20 threshold, that's a concrete, visual reason to adjust the rule instead of guessing.
FAQ
How often is the index updated? Alternative.me and CoinMarketCap both update the Fear and Greed Index once daily, with the score reflecting the prior 24 hours of aggregated data.
Is the Fear and Greed Index reliable? It's directionally useful as a sentiment gauge but lagging by nature and prone to false signals when used alone — most traders treat it as one confirming input rather than a standalone system.
Can it be automated? Yes. A Fear and Greed threshold can be set as a condition inside a no-code strategy builder, combined with technical indicators, and backtested before it's used on live capital.
Where does the data come from? It's aggregated from Bitcoin price volatility, trading volume and momentum, social media sentiment, Google Trends search data, and Bitcoin dominance, published primarily by Alternative.me and mirrored by CoinMarketCap.
Build and backtest your own Fear and Greed-based strategy visually with Quberas — no coding required.