Indicators & Strategies TradingView: Build & Automate | Quberas
Knowing how to read an indicator on a chart and knowing how to turn it into a working, automated strategy are two very different skills. Most TradingView users are stuck in the gap between them: they can spot an RSI divergence or a moving average crossover, but the moment they try to systematize that into something testable and repeatable, TradingView points them toward Pine Script. This guide covers the full path — from understanding what indicators actually do, to converting them into explicit strategy rules, to backtesting and automating without writing a single line of code.
What TradingView Indicators Actually Do
TradingView indicators are calculation engines. They take raw price and volume data as inputs, run a mathematical formula, and output a result — a line, a histogram bar, a shaded zone, or a plotted signal marker. That output appears on your chart, but it does not do anything on its own.
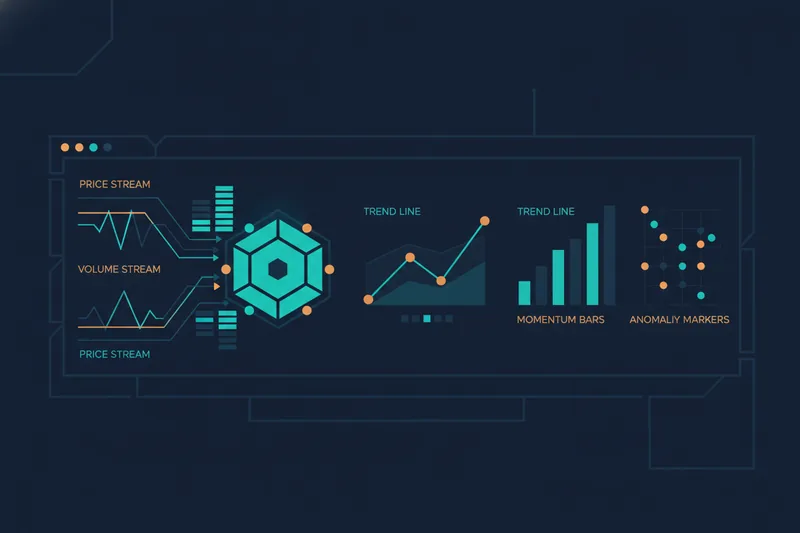
Overlay indicators vs. oscillators: what each type shows
Indicators differ in how they display their output, among other characteristics. Two common display formats are overlays and oscillators, though many indicators don't fit neatly into either category.
-
Overlay indicators plot directly on the price chart. Moving averages — including the Simple Moving Average (SMA) and the Exponential Moving Average (EMA) — are widely used examples. They smooth price data over a defined period to show trend direction. Bollinger Bands are also overlays: they plot a middle SMA with upper and lower bands set at a standard deviation distance, showing how wide or tight price volatility is at any moment.
-
Oscillators typically live in a separate panel below the chart and fluctuate within a bounded range. The RSI (Relative Strength Index) is a common example — it measures the speed and magnitude of recent price changes on a 0–100 scale, with certain threshold levels commonly used to identify potential momentum extremes, though the specific thresholds and their interpretation vary by trader and market context.
Why a signal on a chart is not the same as a trade rule
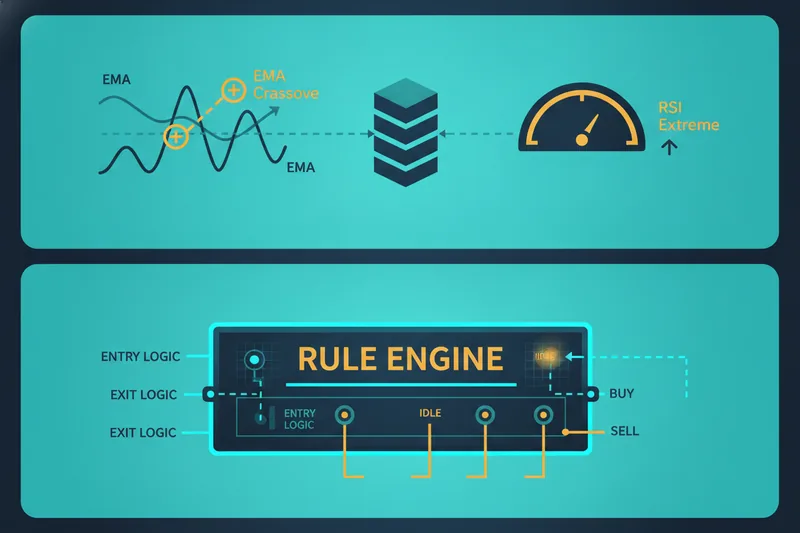
When an EMA crosses above a slower SMA, TradingView draws that event on your chart. When RSI reaches an extreme reading, you can see it. These are measurements — they tell you something about market conditions at a point in time. They do not tell you when to enter, how much to risk, when to exit, or what to do if the market moves against you. A buy/sell signal marker is a visual cue. An executable trade rule is a conditional statement with defined inputs, thresholds, and outcomes. Conflating the two is the root cause of most failed automation attempts.
Indicators vs. Strategies: A Critical Distinction
This is the most important conceptual divide in algorithmic trading, and most content glosses over it.
An indicator measures. A trading strategy decides. A strategy definition typically includes components such as:
- Entry conditions — the specific, testable criteria that must be true before a position opens
- Exit conditions — both take-profit targets and the conditions that close a winning trade
- Stop-loss rules — the maximum loss threshold that closes a losing trade automatically
- Position sizing — how much capital or how many units to commit per trade
Depending on the strategy, additional components like averaging rules or time-based filters may also be relevant.
What a complete strategy definition includes
Take a moving average crossover as an example. "The 9 EMA crossed above the 21 EMA" is an indicator event. A strategy built on that event looks like this: Enter long when the 9 EMA crosses above the 21 EMA AND RSI is below a defined threshold. Exit when price closes below the 21 EMA. Stop-loss at 2% below entry. Risk 1% of account per trade. Every element is defined, testable, and unambiguous.
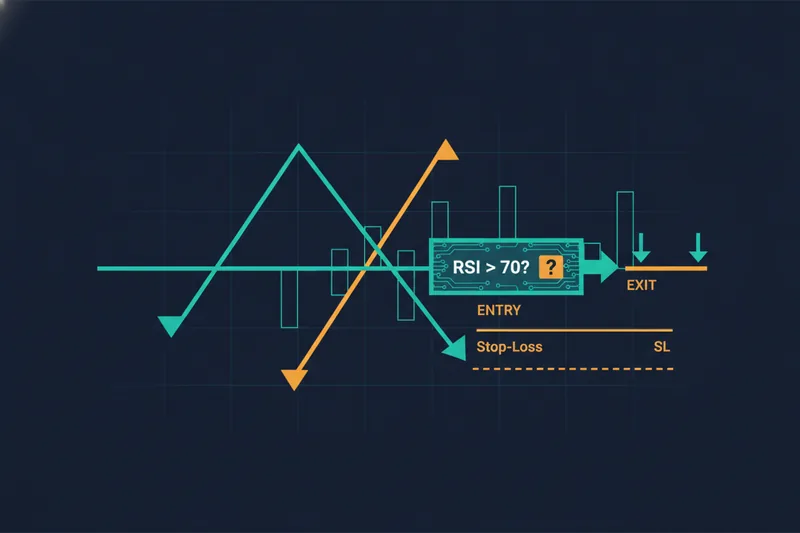
Why indicator stacking without logic rules leads to inconsistent results
A common pattern among traders moving toward automation is adding more indicators hoping clarity will emerge — RSI plus MACD plus Bollinger Bands plus a volume filter. But stacking indicators is not the same as building a strategy. Without explicit conditional logic connecting them (AND, OR, threshold values, sequence requirements), you have a cluttered chart and no repeatable decision process. The trial-and-error indicator stacking problem produces inconsistent results precisely because the rules were never written down in the first place.
The Most Useful TradingView Indicators for Strategy Building
The goal here is not a ranked list — it is a practical reference for what each indicator measures and what kind of strategy condition it is best suited to define.
Trend indicators: moving averages and crossovers
SMAs and EMAs define trend direction and generate crossover conditions — one of the most common strategy trigger types. A crossover fires when a faster average crosses a slower one, signaling a potential shift in momentum. EMAs and SMAs differ in how they weight historical price data, which affects how quickly each responds to recent price moves and how frequently your entry condition fires.
Momentum indicators: RSI and threshold-based conditions
RSI is well-suited to threshold-based entry conditions: enter only when RSI is below a defined level to avoid chasing extended moves, or exit when RSI reaches an upper threshold. It can also be used to define divergence conditions, though those are harder to encode precisely. RSI tends to work best as a filter layered on top of a trend signal, rather than as a standalone entry trigger.
Volatility indicators: Bollinger Bands and range logic
Bollinger Bands define price range conditions. A price touch of the lower band in an uptrend is a different signal than the same touch in a downtrend — context matters. Bands contracting (low volatility) often precede expansion moves, which can be used to define breakout entry conditions. The band width itself is a measurable value you can build rules around.
Volume confirmation: why signal strength matters
Volume indicators — such as On-Balance Volume (OBV) or volume relative to a moving average — confirm whether a price move has participation behind it. A crossover signal on low volume is a weaker trigger than the same crossover accompanied by above-average volume. Adding a volume condition to an entry rule filters out a meaningful portion of false signals.
On TradingView, many well-known indicators are available through the public library. Some third-party indicators published by independent authors are invite-only or require a separate paid subscription to that author's service. Check TradingView's current plan page for specifics on what each tier includes, as these details change over time.
How to Turn an Indicator into a Trading Strategy
Step 1: Define the entry condition in plain logic
Start in plain language before touching any tool. Write out the exact condition: "Enter long when the 9 EMA crosses above the 21 EMA on the 1-hour chart, and RSI on the same timeframe is within a neutral range." Every variable — the indicator, the threshold, the timeframe, the direction — must be explicit. Vague conditions produce inconsistent entries.
Step 2: Add exit rules and stop-loss conditions
Define your exit before you define your entry. Decide: what closes a winning trade (a fixed take-profit level, a trailing stop, a counter-signal)? What closes a losing trade (a fixed stop-loss percentage, a candle close below a key level)? These are not optional refinements — they are core strategy components without which you have an entry trigger and nothing else.
Step 3: The Pine Script path — what it involves
Pine Script is TradingView's native scripting language for building indicators and strategies. To convert your plain-language rules into a testable Pine Script strategy, you need to write syntactically correct code, understand Pine Script's execution model (how it processes bars), and debug logic errors that are not always obvious from the output. For traders with programming experience, it is a capable tool. For traders without it, the learning curve is steep and the feedback loop is slow — a logic error in your entry condition may not surface until you run a backtest and notice unexpected results.
The transparency problem is real: in a Pine Script strategy, it is not always obvious why a rule fired on a specific bar without adding explicit debug plots, which requires more code.
Step 4: The no-code path — building the same logic visually
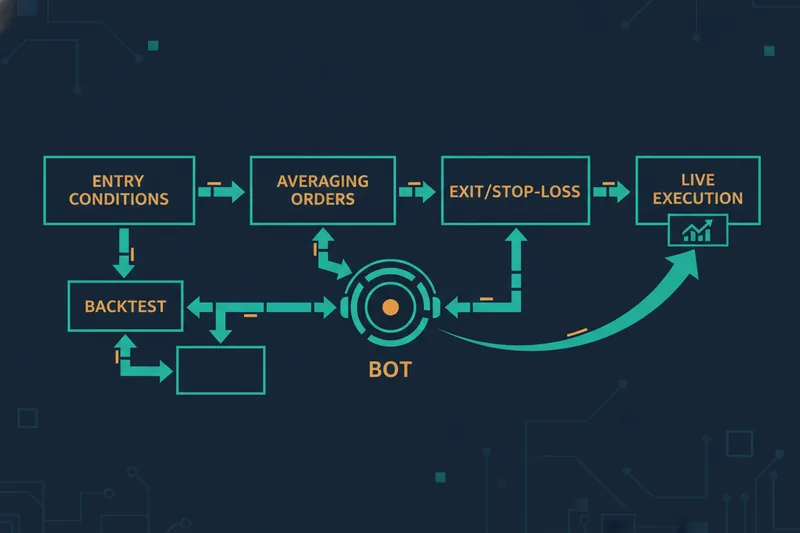
A no-code strategy builder lets you define the same conditional logic through a visual interface rather than code. In Quberas, the deal map is the drag-and-drop canvas where you connect entry conditions, averaging orders, exit rules, and stop-losses as linked components. The condition builder supports nested logic — AND/OR combinations, crossover conditions, threshold comparisons across price, indicators, and volume — without writing syntax. Critically, the visual debugger highlights on the chart exactly where each condition triggered, so you can see why a rule fired on any given bar without adding a single line of code.
Backtesting: Validating Your Strategy Before Going Live
Backtesting is the process of running your strategy's rules against historical price data to see how they would have performed. It is not a guarantee of future results, but it is the only way to identify whether your logic is coherent before risking real capital.
What backtesting results actually tell you
The core metrics to evaluate are win rate (percentage of trades that closed profitably), drawdown (the largest peak-to-trough decline in equity during the test period), and profit factor (gross profit divided by gross loss). A strategy with a modest win rate can still be profitable if the average winner is significantly larger than the average loser. These numbers together tell you whether the logic has edge — not whether it will work in every future market condition.
TradingView's Strategy Tester: capabilities and limitations
TradingView's built-in Strategy Tester runs backtests on Pine Script strategies and provides a solid summary of performance metrics. Its limitations are worth understanding:
- It requires a Pine Script strategy — you cannot backtest a set of conditions you have only defined visually or in plain language
- Historical data range varies by plan tier
- Repainting indicators — those whose signals can appear differently in live conditions than they did during a backtest — are a known pitfall worth researching before relying on any indicator's historical performance
- Look-ahead bias (where a strategy inadvertently uses future data to make past decisions) is a related risk that requires careful Pine Script construction to avoid
- TradingView's Strategy Tester has no live execution bridge — a validated strategy cannot be deployed directly from TradingView to an exchange
Visual backtesting in a no-code environment
In a no-code workflow, backtesting is part of the same environment where you built the strategy. Quberas runs the backtest and overlays rule trigger zones directly on the chart — you can see exactly which bars triggered an entry, which conditions were active, and where the exit fired. This makes it faster to identify logic problems and iterate on conditions without switching between a code editor and a chart.
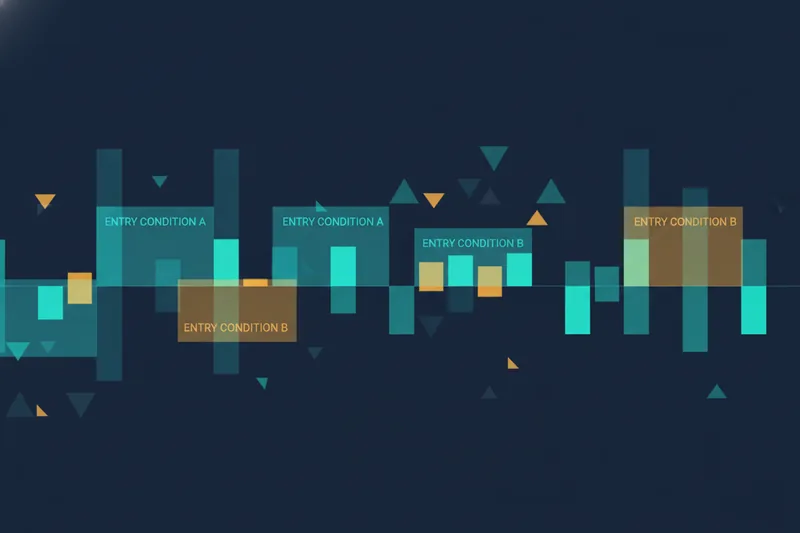
From Backtest to Live Automation: The Full Workflow
Why TradingView alone doesn't automate your trades
TradingView is a charting and analysis platform with strategy testing capabilities. It does not execute trades. Bridging a TradingView strategy to live execution typically requires additional configuration and third-party tooling — each additional component introduces complexity that goes well beyond the strategy logic itself.
What a complete no-code automation workflow looks like
An algorithmic trading bot executes your strategy's rules automatically — opening positions when entry conditions are met, managing averaging orders if your strategy uses them, and closing positions when exit or stop-loss conditions trigger. The bot is the execution layer; your strategy logic is what it runs.
A complete build-to-launch workflow covers: defining entry conditions → setting averaging order rules (if applicable) → defining exit conditions and stop-losses → backtesting the full logic → connecting to live exchange execution. Quberas is designed to handle this entire sequence in one environment, without requiring additional execution middleware. The same deal map you built and backtested is what the bot runs live.
Limitations of TradingView's Strategy Tools — and When to Use a Dedicated Platform
What TradingView's strategy tools do well
TradingView is genuinely strong for charting, indicator access, and community-shared scripts. Its Strategy Tester provides meaningful backtesting data for traders who can write Pine Script. For traders who are comfortable coding and primarily want to analyze historical performance, it is a capable tool.
Where the Pine Script dependency creates friction
Pine Script as a barrier is not a minor inconvenience — it is a hard gate. Every strategy feature (entry logic, exit logic, stop-loss, position sizing) must be expressed in code. Modifying a condition means editing code, re-saving, and re-running the backtest. Debugging unexpected behavior requires adding more code. For traders whose skill is in reading markets, not writing programs, this is a significant ongoing cost.
The transparency problem: knowing when and why a rule fires
TradingView has no native visual debugger for strategy rule triggers. You can see the entry and exit markers on the chart, but understanding why a specific bar triggered — which condition was true, which was false — requires either adding debug plots in Pine Script or manually cross-referencing indicator values. This opacity makes iterating on strategy logic slow and error-prone.
When your priority is building, testing, and refining strategy logic — not writing and debugging code — a dedicated no-code platform adds clear value. The visual debugger in Quberas addresses the transparency gap directly: condition trigger zones are overlaid on the chart, so the logic is always visible and auditable without additional code.
Frequently Asked Questions
Are TradingView indicators free?
Many indicators in TradingView's public library are accessible without payment, but availability depends on your plan and the specific script. Some third-party indicators published by independent authors are invite-only or require a paid subscription to that author's service, separate from any TradingView plan. For current details on what each plan tier includes, check TradingView's official pricing page directly.
What is the most accurate buy/sell indicator on TradingView?
There is no single most accurate indicator — accuracy depends entirely on the market, timeframe, and conditions the indicator is applied to. Any indicator used in isolation will produce false signals. The more useful question is which indicator is best suited to define a specific type of condition (trend, momentum, volatility, volume) within a complete strategy that includes entry logic, exit rules, and risk management.
Can I automate a TradingView strategy without Pine Script?
Not directly within TradingView. Taking a strategy from TradingView to live execution without Pine Script requires additional tools and configuration steps. A no-code strategy builder like Quberas lets you build, backtest, and launch an automated strategy entirely without code, in a single environment.
What is the difference between an indicator and a strategy on TradingView?
An indicator measures market data and outputs a value or signal. A strategy is a complete set of conditional rules — entry conditions, exit conditions, stop-loss, and position sizing — that produces executable trade decisions. In TradingView's technical terms, indicators are Pine Script scripts that use plot() functions; strategies use strategy.entry() and strategy.exit() functions and can be run through the Strategy Tester.
Do I need TradingView to use Quberas?
No. Quberas is a standalone platform with its own charting and condition-building environment. You do not need a TradingView account or Pine Script knowledge to build, backtest, and automate strategies on Quberas.
Ready to turn your TradingView indicators into a fully automated strategy — without writing a line of Pine Script? Build, backtest, and launch your first strategy visually with Quberas.