Day Trading Strategies, Risks & Automation | Quberas
Day trading — buying and selling financial instruments within a single session to profit from short-term price movements — is one of the most searched and most misunderstood topics in retail finance. This guide covers what it actually is, which strategies work and why, what the income reality looks like, and — critically — how to convert your intraday rules into a visual, backtested, automated system instead of relying on gut feel and manual execution.
What Is Day Trading?
Day trading is the practice of opening and closing positions within the same trading day, so no trades are held overnight. The goal is to capture intraday buying and selling opportunities created by short-term price fluctuations — moves that might last minutes or hours but rarely span sessions.
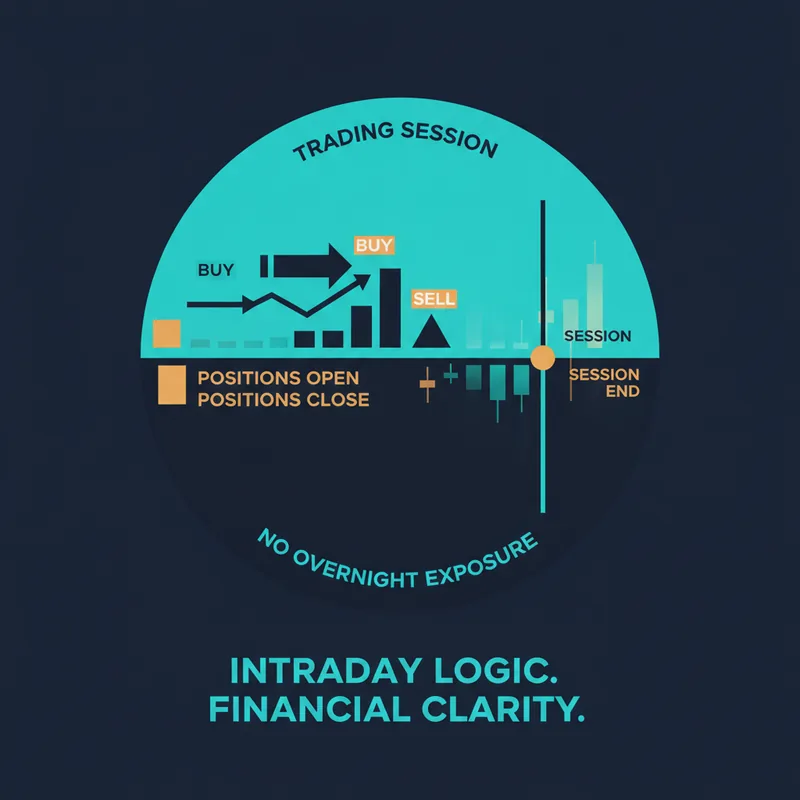
It's practiced across multiple markets: stocks, crypto, forex, and futures. Each has different hours, liquidity profiles, and volatility characteristics, but the core mechanic is identical — find a repeatable edge in short-term price behavior and execute it consistently.
Day trading differs meaningfully from related approaches. Swing trading holds positions for days to weeks, tolerating overnight risk in exchange for larger moves. Investing operates on months or years, ignoring intraday noise entirely. Day trading sits at the opposite end: maximum activity, minimum holding time, and a hard requirement to close flat before the session ends.
That constraint — no overnight exposure — is both the defining feature and the primary discipline challenge.
How Day Trading Works
Reading Intraday Price Action
Every intraday trade starts with identifying an opportunity. Day traders use technical indicators — mathematical calculations applied to price and volume data — to find high-probability setups.
The most commonly used indicators include:
- Moving averages — smooth price data to identify trend direction; the 9 EMA and 20 EMA are popular intraday references
- RSI (Relative Strength Index) — a momentum oscillator (0–100 scale) that flags overbought (>70) or oversold (<30) conditions
- VWAP (Volume-Weighted Average Price) — the average price weighted by volume throughout the session; institutional traders use it as a benchmark, making it a reliable intraday support/resistance level
- Volume — confirms whether a price move has conviction behind it
Volatility — the degree of price fluctuation — is the raw material day traders work with. Without it, there's no movement to capture. With too much of it and no structure, there's only noise.
Entry and Exit Conditions: The Core of Every Trade
A trade is defined by two decisions: when to get in and when to get out. Entry and exit conditions are the explicit rules that govern both.
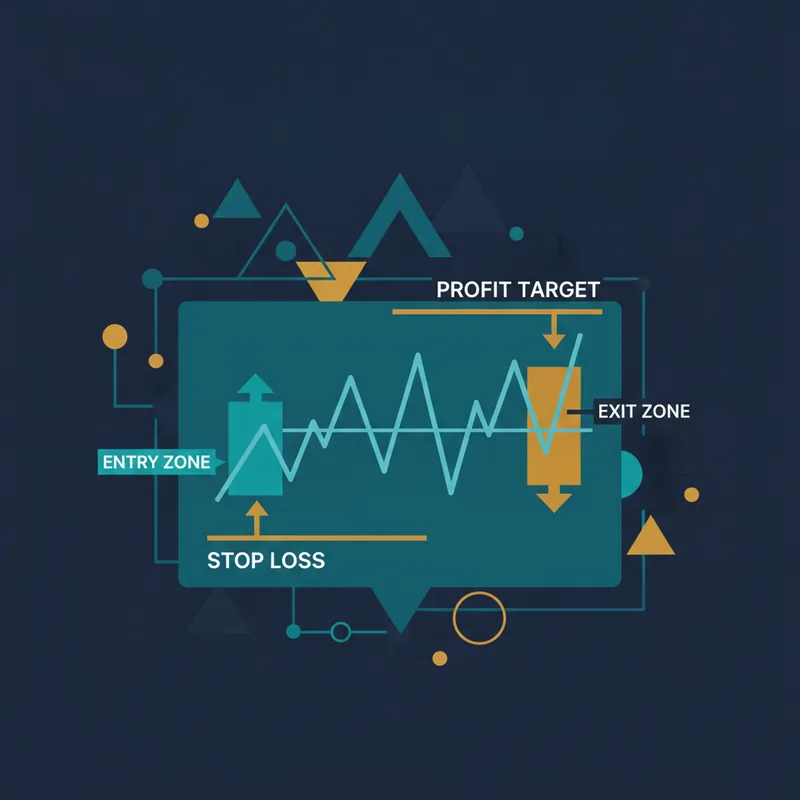
Entry conditions might be: "Price crosses above VWAP AND RSI is above 50 AND volume is 1.5× the 20-period average." Exit conditions include a profit target (e.g., 2× the initial risk) and a stop-loss — a predefined price level where the trade closes automatically to cap the loss.
Order types matter here. A market order fills immediately at the best available price; a limit order fills only at a specified price or better; a stop order triggers when price hits a threshold. Liquidity and spread (the gap between bid and ask) determine how cleanly those orders execute — in thin markets, slippage can erode an edge entirely.
The Pattern Day Trader (PDT) Rule Explained
US stock traders face a regulatory constraint worth knowing upfront. The Pattern Day Trader (PDT) rule is a US regulatory requirement that applies to margin accounts in US equities and options markets. Under this rule, traders classified as pattern day traders are required to maintain a minimum account equity level — check with your broker and the relevant regulatory guidance for the current threshold and exact conditions, as requirements can vary by account type and broker.
The PDT rule does not apply in the same way to all markets. Traders operating in forex or crypto markets should verify the specific rules that govern their account type with their broker directly.
Common Day Trading Strategies
Scalping: Capturing Small, Frequent Moves
Scalping targets tiny price increments — sometimes just a few cents or basis points — across a high volume of trades. A scalper might execute dozens of trades per session, each held for seconds to minutes.
The edge relies on tight spreads, high liquidity, and fast execution. Indicators used: Level 2 order book, 1-minute charts, moving averages for micro-trend direction. The risk: transaction costs accumulate rapidly, and a single large loss can wipe out many small wins.
Momentum Trading: Riding the Trend
Momentum trading identifies assets moving strongly in one direction — usually triggered by news, earnings, or a technical breakout — and enters in the direction of that move.
Entry signal example: price breaks above the prior day's high with volume 2× the average, and MACD histogram is positive. The trade rides the move until momentum stalls, signaled by a reversal candle or RSI divergence. MACD (Moving Average Convergence Divergence) measures the relationship between two exponential moving averages and is a standard momentum confirmation tool.
Breakout Trading: Entering at Key Levels
Breakout trading focuses on price breaking through a defined support or resistance level — a previous high, a consolidation range boundary, or a VWAP level — with the expectation that the break triggers a sustained move.
Entry is placed just above the breakout level; stop-loss sits just below it. Volume confirmation is essential — a breakout on low volume frequently fails and reverses, trapping breakout buyers.
Mean Reversion: Fading Extremes

Mean reversion operates on the opposite assumption: that prices stretched far from their average will snap back. Bollinger Bands — which plot standard deviation bands around a moving average — are the primary tool. When price touches or pierces the outer band, a mean reversion trader fades the move, betting on a return to the midline.
This strategy performs well in range-bound, low-trend environments and poorly in strong trending conditions — which is why knowing the market regime matters before applying any strategy.
Risks of Day Trading
Why Most Day Traders Lose Money
The statistics are consistent and sobering. Studies across multiple markets — including widely cited analyses of retail futures and forex accounts — show that the majority of retail day traders lose money over any meaningful time horizon, and many quit within the first two years.
The reasons are structural: transaction costs (commissions, spreads, slippage) create a constant headwind. Leverage — borrowing to amplify position size — magnifies losses as readily as gains. And volatility, while necessary for opportunity, punishes undisciplined sizing.
Emotional Bias: The Hidden Cost of Manual Execution
Beyond the math, manual execution introduces behavioral costs that compound the structural ones. Traders hold losing positions too long (loss aversion), cut winners too early (fear of giving back gains), overtrade after losses (revenge trading), and size up recklessly after wins (overconfidence).
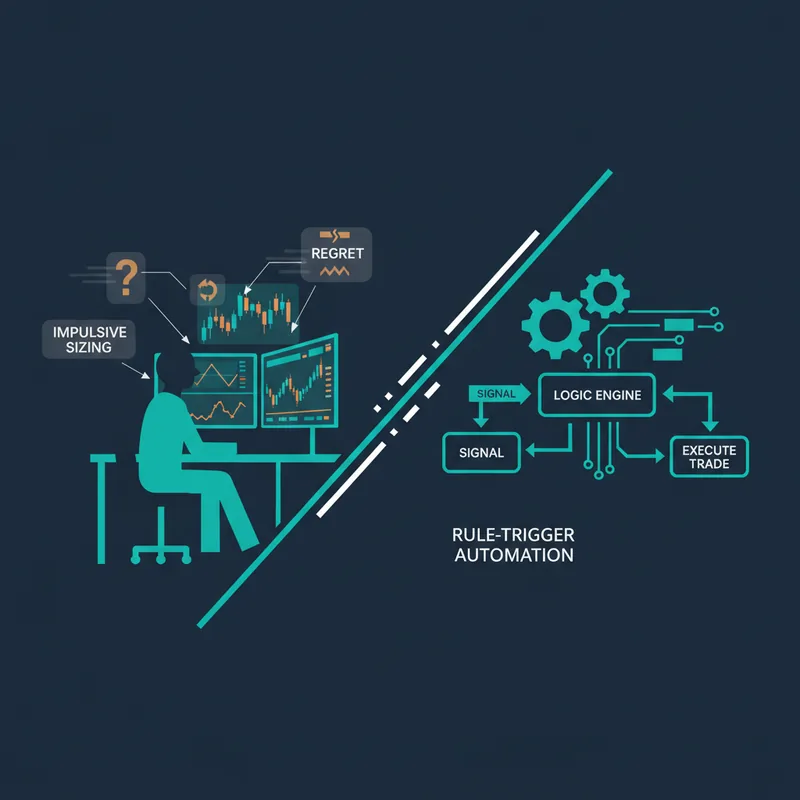
These aren't character flaws — they're documented cognitive biases that affect every human decision-maker under uncertainty. The problem is that discretionary day trading puts those biases in charge of every single trade.
Rule-based and algorithmic trading approaches don't eliminate risk, but they remove the execution layer where most behavioral errors occur. A rule either fires or it doesn't — there's no hesitation, no second-guessing, no emotional override.
Risk Management Rules Every Day Trader Needs
Regardless of strategy, these principles apply:
- Position sizing: Risk a fixed percentage of capital per trade — most professional frameworks cap this at 1–2% of account equity per position
- Stop-losses: Define the maximum loss before entering, not after
- Risk-reward ratio: Only take trades where the potential gain is at least 2× the potential loss; a 40% win rate with a 2:1 ratio is profitable
- Day trading vs. gambling: The distinction is rule-based repeatability. A casino game has fixed, unknowable odds. A backtested strategy with defined entry conditions, a stop-loss, and a measured risk-reward ratio has a quantifiable expected value — which can be positive
How Much Can Day Traders Make?
What Determines a Day Trader's Income?
Income from day trading is a function of three variables: win rate (percentage of trades that are profitable), risk-reward ratio (average winner size vs. average loser size), and starting capital. These interact multiplicatively — improving any one of them improves outcomes, but none of them works in isolation.
A trader with a 45% win rate and a consistent 2.5:1 risk-reward ratio has a positive expected value per trade. A trader with a 60% win rate but a 0.8:1 ratio loses money over time.
Starting Small: What's Realistic with Limited Capital?
The math is unforgiving at small account sizes. A $1,000 account generating a 5% monthly return — which would be exceptional — produces $50. The same return on a $10,000 account produces $500. Percentage returns are the metric; dollar amounts depend entirely on capital base.
With $100, meaningful compounding is nearly impossible after transaction costs. With $1,000–$5,000, a trader can practice real-money discipline but should expect learning costs. With $10,000+, a consistent edge begins to produce more meaningful returns.
The PDT rule's minimum equity requirement for US stocks exists partly because regulators recognize that undercapitalized traders tend to take disproportionate risks.
Consistency Over Home Runs: The Backtesting Advantage
The traders who survive long-term optimize for consistency, not maximum single-day gains. A strategy that generates steady, repeatable weekly returns compounds far more reliably than one that swings between large gains and large losses — the latter produces anxiety, overtrading, and eventual blowup.
Backtesting — running a strategy's rules against historical price data to measure how it would have performed — is the tool that separates consistent strategies from lucky ones. It reveals win rate, drawdown, average trade duration, and expected value before a single dollar is risked. Automation then removes execution variance, ensuring the live strategy matches the backtested one.
Day Trading Tools and Platforms
Charting and Screening Tools
The baseline toolkit includes a charting platform with real-time data and the ability to overlay technical indicators, plus a screener to filter the universe of tradable assets down to candidates meeting specific criteria (e.g., stocks with volume above 1M shares and price movement above 3% in the first 30 minutes).
Backtesting and Simulation: Test Before You Risk Capital
Paper trading — simulated trading using real market data but no real money — is the standard first step for testing a strategy live. It removes financial risk but preserves market conditions. Most serious traders combine paper trading with formal backtesting: paper trading tests real-time execution; backtesting tests the strategy's historical edge across hundreds or thousands of historical setups.
A day trading simulator that lets you replay historical sessions and test entries manually is useful for discretionary traders. For systematic traders, a backtesting engine that runs rules automatically across years of data is more powerful.
No-Code Strategy Builders: A New Category of Day Trading Tool
Traditional backtesting required either coding (Python, Pine Script, EasyLanguage) or accepting the limitations of rigid, parameter-based tools. A third category has emerged: no-code strategy builders that let traders define logic visually and backtest it without writing a line of code.
Quberas is built specifically for this workflow. Its drag-and-drop deal map interface lets traders construct a full strategy — entry conditions, averaging orders, exits, stop-losses — by connecting logic blocks visually. The puzzle-style condition builder supports nested logic: price AND indicator conditions, crossovers, volume thresholds, combined with OR/AND operators. The visual debugger then highlights on the chart exactly where each condition triggered historically, so traders can see their logic in action on real price data before committing capital.
Day Trading vs. Algorithmic Trading
What Algorithmic Trading Actually Means for Retail Traders
Algorithmic trading strategies are rule-based systems that execute trades automatically when predefined conditions are met. The algorithm doesn't interpret — it checks conditions and acts. Speed, consistency, and emotion-free execution are the primary advantages.
The common misconception is that algorithmic trading requires programming skills and institutional infrastructure. That was true a decade ago. It's no longer true.
The No-Code Bridge: From Manual Rules to Automated Strategy
The gap between "I have a day trading rule" and "I have a running automated strategy" used to require a developer. No-code visual platforms close that gap. The workflow is:
- Build — define your strategy logic visually using a condition builder
- Visualize — see exactly where your rules trigger on historical chart data
- Backtest — measure performance metrics across historical data
- Launch — deploy the strategy as an automated trading bot
This is the same workflow professional quant traders use — the difference is the interface. Retail traders who understand their own intraday edge can now systematize it without writing code, and verify it against history before going live.
How to Get Started with Day Trading (and Systematize It from Day One)
Step 1: Choose Your Market and Strategy
Pick one market — stocks, crypto, or forex — and learn its specific characteristics before diversifying. Each market has its own session hours, liquidity profile, and regulatory environment. US stocks carry the PDT rule for margin accounts; forex and crypto have their own distinct rules and risk profiles. Verify the specific requirements that apply to your account type and jurisdiction before trading.
Within your chosen market, start with one strategy. Momentum breakout is a common starting point because the logic is intuitive and the signals are clear.
Step 2: Write Down Your Rules — Entry, Exit, Stop-Loss
Before touching any tool, write your rules in plain language. For example:
- Entry: Price breaks above the 15-minute high, VWAP is below current price, RSI (14) is above 55, volume on the breakout candle is 1.5× the 20-period average
- Stop-loss: Close below the breakout candle's low
- Exit: Price reaches 2× the distance from entry to stop-loss (2:1 risk-reward)
Explicit rules are the prerequisite for both backtesting and automation. Vague rules ("buy when it looks strong") cannot be tested or systematized.
Step 3: Build and Backtest Your Strategy Visually
Take those written rules and translate them into a visual strategy builder. The momentum breakout example above becomes a set of connected condition blocks: a price crossover condition, a VWAP relationship condition, an RSI threshold, and a volume filter — all linked with AND logic in the condition builder.
Once built, run the visual debugger. It highlights on the historical chart every candle where all conditions were simultaneously true, and shows the resulting trade outcome. This is where most traders discover that their "obvious" rule fires in conditions they didn't intend — and can refine it before it costs real money.
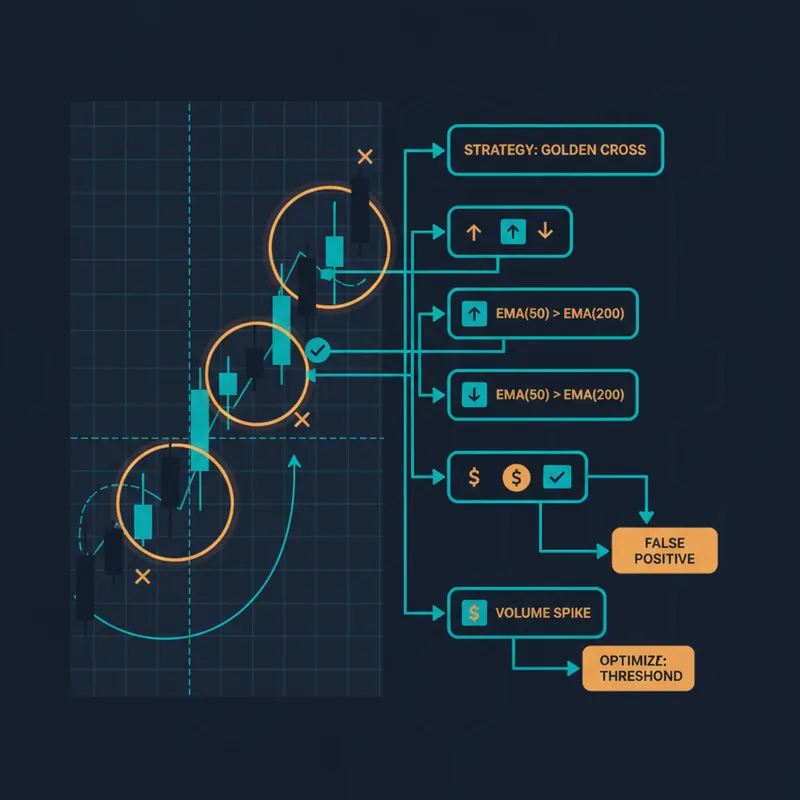
Backtest across at least 3–6 months of historical data. Review win rate, maximum drawdown, and average risk-reward achieved. If the numbers don't support the strategy, iterate — not with real capital, but with the builder.
Step 4: Go Live with Confidence
After backtesting shows a positive expected value, paper trade the strategy live for 2–4 weeks to verify real-time execution matches the backtest. Then launch with a small position size — 1% risk per trade maximum — and monitor for the first 30–50 trades before scaling.
The goal isn't a perfect first strategy. It's a repeatable process: define rules, test visually, verify historically, launch small, refine. That loop — not a single winning trade — is what separates traders who last from those who don't.
Ready to turn your day trading rules into a backtested, automated strategy? Build your first no-code intraday bot on Quberas — see exactly where your logic triggers on the chart before you risk a single dollar.