ATR Trading Strategy: Read, Apply & Automate
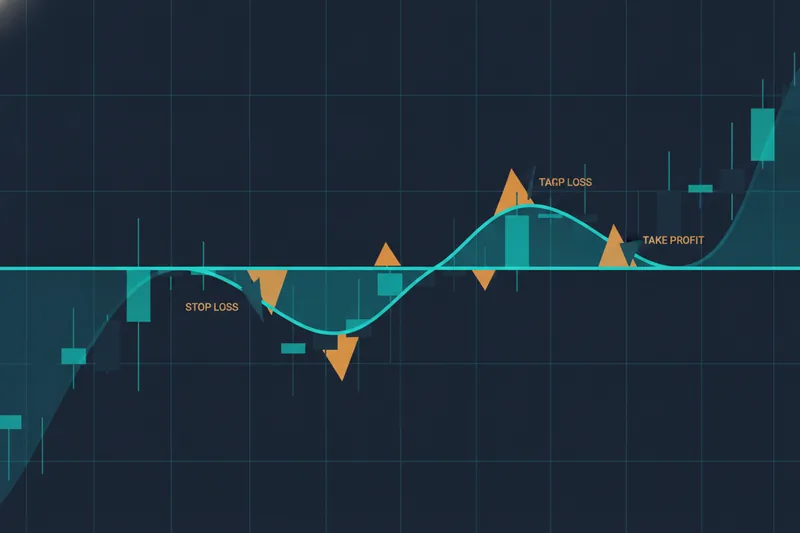
An ATR trading strategy uses Average True Range - a measure of how much a market typically moves per bar - to set stop-loss distances, take-profit targets, and position sizes that adjust automatically to current volatility, instead of relying on fixed price levels that work in one market condition and fail in another. This guide walks through how ATR is calculated, how to read it on a chart, the main strategy types built on it, and how to turn those rules into something you can backtest and eventually automate.
What Is ATR (Average True Range)?
Average True Range measures how much a market typically moves within a given period - not which direction it moves. As a volatility indicator, ATR tells you whether price is chopping through a tight range or swinging wide, which matters before you decide where to place a stop-loss or how large a position to take. It says nothing about trend direction: a rising ATR can accompany a strong rally or a sharp sell-off equally. That's the gap most traders hit - they read an ATR value correctly, then have no repeatable way to turn it into an entry rule, a stop distance, or a position size they can test before risking money. Platforms built for visual strategy building, such as Quberas, exist to close exactly that gap, letting you wire an ATR reading into an actual rule on the chart rather than leaving it as a number you eyeball.
How Is ATR Calculated?
ATR starts with True Range, the largest of three values for a given bar: the current high minus the current low, the absolute value of the current high minus the previous close, and the absolute value of the current low minus the previous close. Taking the largest of the three catches gaps that a simple high-minus-low reading would miss. ATR itself is a moving average of True Range, smoothing out the noise of any single bar. The standard setting uses a 14-period lookback - typically 14 days on a daily chart - applying a smoothing method that weights recent values more heavily than a plain average would. The result is one number, in price units, representing the average range a market has covered per bar over that window.
How to Read and Use ATR on a Chart
ATR is timeframe-dependent: a 14-period ATR on a 5-minute chart measures something entirely different from the same setting on a daily chart, so always read the value alongside the timeframe it came from. A rising ATR line means each bar is covering more ground - volatility expanding, often around news, session opens, or breakouts. A falling ATR signals contraction, the kind of quiet that often precedes a range resolving into a move. Neither reading tells you which way price will go next; ATR is context for a decision, not a trade signal by itself. Traders use it to size stops and targets appropriately for current conditions, leaving the timing of entries to price action or another indicator layered on top.
ATR Trading Strategies: Breakout, Trend-Following, and Reversal
ATR rarely trades alone. It's usually paired with a price or momentum condition, and the three approaches below cover most of how traders apply it - alongside range, gap, and other day-trading approaches that lean on volatility differently.
ATR Breakout Strategy
A breakout setup uses ATR to confirm that a price move is genuinely large enough to matter. If price clears a recent high or resistance level by more than roughly one ATR, that move carries more weight than a break of a few ticks during a quiet session - it filters out breakouts that are really just noise inside the day's normal range.
ATR Trend-Following Strategy
In a trend-following approach, ATR sets the distance for a trailing stop - a stop-loss that moves with price, staying a fixed multiple of ATR behind the current close so it tightens or loosens automatically as volatility shifts, letting a winning position run without an arbitrary fixed exit.
ATR Reversal Strategy
A reversal, or mean-reversion, approach flags moves that have stretched unusually far relative to ATR - price sitting several ATR units away from a moving average, for instance - on the premise that an overextended move is more likely to snap back toward the average than to keep going at the same pace.
Setting Stop-Loss and Take-Profit Levels with ATR
The most common way to place a stop-loss with ATR is a multiple of the current reading below the entry price for longs, or above it for shorts - 1.5x to 2x ATR is a typical starting range, wide enough to survive normal noise but tight enough to cap the loss if the trade is wrong. Take-profit targets often use a larger multiple, 2x to 3x ATR, so the reward-to-risk ratio stays favorable before a single trade even closes. Some traders formalize this with a fixed risk framework on top - capping risk per individual trade at a small percentage of the account, capping total exposure across open positions, and requiring a minimum profit-to-loss ratio before entering at all. A trailing stop applies the same ATR multiple but recalculates it as price moves in your favor, which is functionally a stop-loss order that updates itself rather than sitting at a fixed level.
Best ATR Period and Settings by Timeframe
The 14-period default is a reasonable starting point on any timeframe, but shorter-term trading generally calls for a shorter lookback so ATR reacts faster to changing conditions.
ATR Settings for Day Trading
On intraday charts, a 7- to 10-period ATR is common, since a 14-period setting can lag the rapid volatility shifts that shape scalping and other short-hold trades on 1-minute to 15-minute bars, where execution speed and spread matter as much as the broader trend.
ATR Settings for Swing Trading
Swing traders holding positions for days or weeks generally keep the standard 14-period setting on daily charts, sometimes extending to 20 or 21 periods for a smoother read that filters out single-day spikes and better reflects the volatility environment a multi-day trade will actually sit through.
Using ATR for Position Sizing and Risk Management
ATR lets you size a position so a fixed dollar or percentage risk corresponds to a fixed distance in price, regardless of how volatile the market currently is. The calculation is simple: divide the amount you're willing to risk on the trade by the ATR-based stop distance, and the result is the position size that keeps risk per trade constant even as volatility rises or falls. A flat position size across changing conditions means the same number of shares or contracts represents very different risk depending on volatility - ATR-adjusted sizing corrects for that. It's worth distinguishing this from a dollar-cost-averaging bot, which buys or sells at fixed intervals regardless of volatility; ATR-based sizing, and averaging orders built into a strategy's own logic, are a volatility-aware alternative to that calendar-based approach.
Building and Backtesting an ATR Strategy Visually
Turning ATR into a strategy you can trust means combining it with at least one other condition - pairing an ATR breakout filter with a moving average crossover, for example, so a trade only triggers when price clears the average and the move is large enough by ATR standards to matter. Automated trading platforms range from full coding environments to no-code visual builders, signal-execution layers, and marketplaces of ready-made bots, and some no-code builders now let traders assemble this kind of logic through drag-and-drop condition blocks, where earlier tools required scripting instead. In a visual condition builder, each rule - the ATR threshold, the crossover, the stop-loss - sits on a deal map alongside entry, averaging, and exit stages, so the whole strategy is visible as one flow rather than buried in parameters. A visual debugger highlights the chart zones where each condition triggered, and where it came close but didn't, which is how you catch a threshold that's too tight or too loose before it costs money live. From there, backtesting the strategy against historical data and then forward testing it are both necessary steps before committing real capital, not a formality either one skips.
Limitations of ATR and Common Mistakes
ATR is a lagging measure - it's built from past bars, so it can understate risk right as volatility is accelerating, and a stop sized on yesterday's ATR may be too tight for today's move. It doesn't predict direction, only magnitude, so pairing it with a directional signal isn't optional if you want a complete strategy. In choppy, low-volatility conditions, ATR-based breakout rules can still throw off false signals - small moves that clear a tight ATR threshold without following through. And it's easy to over-optimize the ATR period against a backtest until it fits historical data perfectly, only to see it underperform once conditions shift; a setting that holds up reasonably well across different periods is worth more than one tuned perfectly to the past.
Reading ATR correctly is only half the job - the payoff comes from turning it into a rule you can see, test, and trust before it touches live capital. Build your ATR-based strategy visually in Quberas: set entry, stop-loss, and trailing exit conditions on the deal map, then backtest it against historical data before risking real capital, no code required.