What Is the ICT Trading Strategy? A Clear Guide
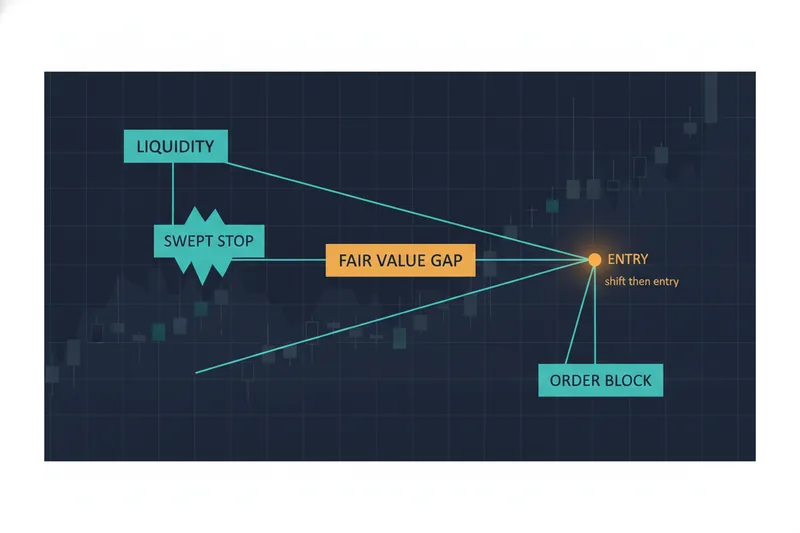
The ICT trading strategy is a price-action approach to reading markets that focuses on how large institutional players — banks, funds, market makers — leave traces in price as they build and unwind positions. Rather than relying on indicators, it reads structure shifts, liquidity grabs, and imbalance zones to infer where big money is forcing price to move. Understanding these mechanics is the starting point: before anyone can turn a discretionary read of a chart into a repeatable process, they need to know what each piece of the framework actually means and how it fits together.
ICT Trading in One Sentence: Definition and Origin
ICT trading, often written as "ICT concepts," is a price-action methodology for reading institutional order flow — the footprint that large market participants leave in price as they accumulate or exit positions — through shifts in market structure, liquidity sweeps, and gaps left by fast, aggressive price moves.
The framework takes its name from Michael J. Huddleston, who has taught under the handle Inner Circle Trader (ICT) for over a decade. Its core premise is that retail price action is largely a reaction to how institutional players operate: because large orders can't be filled at a single price without moving the market, they need pools of opposing liquidity to trade against, and price is drawn toward those pools before reversing. ICT trading sits alongside other named trading styles that traders adopt as a defined approach — in the same way some traders commit to range trading, trend trading, or breakout trading as their style — except ICT's organizing idea is specifically "find where liquidity sits, then watch for the shift that shows it's been taken."
How ICT Reads the Market: Core Concepts Explained
Market structure is simply the shape price is tracing on a chart: a sequence of rising swing highs and swing lows describes an uptrend, a sequence of falling highs and lows describes a downtrend. ICT treats structure as the baseline that everything else — liquidity, gaps, entries — gets measured against, because it tells you which direction the chart is currently "supposed" to go.
Break of Structure (BOS)
A break of structure happens when price pushes past the most recent significant high (in an uptrend) or low (in a downtrend) in the direction the trend is already moving. It's read as confirmation that the existing trend is intact and that the players pushing price in that direction are still in control.
Change of Character (CHOCH)
A change of character is the opposite signal: price breaks structure against the prevailing trend — for example, an uptrend failing to make a new high and instead breaking below the most recent higher low. It's the first technical clue that control may be shifting from buyers to sellers, or vice versa, and ICT traders treat it as a prompt to reassess bias rather than as a trade signal on its own.
Together, BOS and CHOCH give a trader a running read of whether to be looking for continuation setups or reversal setups before anything else in the framework gets applied.
Liquidity, Liquidity Grabs, and Imbalance Zones
Liquidity, in this context, means the pending orders sitting at and beyond obvious price levels — stop-losses parked below swing lows, breakout entries waiting above swing highs, orders clustered where a chart shows equal highs or equal lows. These clusters are attractive to large players precisely because they're large and predictable: it's liquidity a bigger order can trade against.
Liquidity Grabs
A liquidity grab, also called a stop hunt or a sweep, is when price pushes just beyond one of these levels, triggers the resting orders, and then reverses. The brief, sharp spike through the level isn't noise to be filtered out — it's read as the market harvesting the liquidity large players needed before moving the other way.
Fair Value Gaps
A fair value gap (FVG) is an imbalance left behind by a fast, one-directional move: across three consecutive candles, the wick of the first and the wick of the third don't overlap, leaving a visible gap in price delivery. That gap marks a zone where one side of the market (buyers or sellers) moved with little resistance, and ICT traders treat it as a level price is statistically likely to revisit to "rebalance" before continuing.
Order Blocks and Breaker Blocks
An order block is the last candle in the opposite direction before a strong impulsive move — the last down-candle before a sharp rally, for instance. It's interpreted as the footprint of where institutional positioning originated, and traders watch for price to return to that zone as potential support or resistance. A breaker block is what's left when an order block fails: price breaks straight through it instead of respecting it, and that same zone is then expected to flip roles — former support turning into resistance, or the reverse — on the next retest.
Timing the Entry: Optimal Trade Entry and Kill Zones
Market structure and liquidity concepts establish bias — which direction to favor — but ICT also has tools for timing the entry itself. Optimal trade entry (OTE) is a retracement zone inside an impulsive move, commonly mapped with Fibonacci retracement levels, used to enter at a relative discount in an uptrend or a relative premium in a downtrend rather than chasing price after a structure shift has already happened.
Kill zones are windows of the trading day tied to the open of major financial sessions — London and New York in particular — when volume and institutional participation are considered highest, and therefore when structure shifts and liquidity grabs are considered more meaningful. Because these entries are about pinpointing a precise turn rather than riding a slower move, they're typically read on lower timeframe charts, where execution and timing carry more weight than on higher timeframes. In practice, once a trader has a zone, the entry itself is built the same way any price-action entry is: a limit order placed at the OTE level, a stop-loss order placed beyond the point that would invalidate the setup, and a market or limit order used to take profit at the next liquidity target.
A Worked Example: Sweep, Shift, Gap, Entry
Picture a pair trading in a range, with price approaching the previous session's low. Instead of simply breaking down, price dips a small amount below that low — sweeping the resting sell-stops and breakout-short orders sitting there — then snaps back above it within a candle or two. That's the liquidity grab.
From there, price rallies hard enough to break above the most recent swing high, which had been capping the range. Because this breaks the prior bearish-leaning structure, it registers as a change of character: the first evidence that sellers have lost control. The impulsive rally that follows leaves a fair value gap — a visible imbalance between candles — roughly in the middle of the move.
Price then pulls back. It retraces into the fair value gap, which happens to overlap with the order block that originated the move, and does so inside the optimal trade entry zone of that rally. If this pullback lands during the New York kill zone, a trader following the framework has four elements lining up at once: a liquidity grab, a change of character confirming new direction, an imbalance zone to retrace into, and a timing window to filter the setup. The entry is placed at that confluence, the stop goes below the sweep low that started the sequence, and the target is the next pool of resting liquidity — typically the high the range had been building toward.
ICT vs. Standard Technical Analysis and Smart Money Concepts
Standard technical analysis builds a view from indicators and chart patterns — moving averages, RSI, trendlines, triangles — on the assumption that price reacts to supply and demand signals visible to every participant in roughly the same way. ICT starts from a different assumption: that price is periodically engineered toward liquidity pools to let large orders fill, and that structure shifts and gaps are the visible residue of that process rather than a pattern repeating for its own sake.
Smart money concepts (SMC) is the term most traders use for the broader school of thought that shares ICT's vocabulary — order blocks, liquidity, break of structure — and in practice the two overlap heavily; SMC is largely a distillation of ICT's teaching into a simplified rule set, sometimes without the top-down, multi-timeframe narrative (daily bias shaping what's traded on lower timeframes) that ICT treats as central. The practical difference for a trader is less about which concepts exist and more about how strictly the top-down narrative is applied before a lower-timeframe entry is taken.
What doesn't change across any of these schools is the need to check whether the read holds up. Whether the analysis comes from classic technical analysis, SMC, or full ICT concepts, it's still a discretionary interpretation of a chart, and that interpretation is generally expected to pass through both backtesting and forward testing before it's trusted with real capital.
Where ICT's Discretionary Framework Breaks Down
The weak point in ICT isn't the concepts themselves — it's that applying them is interpretive. Two traders looking at the same chart can disagree on which swing counts as the relevant liquidity pool, which candle qualifies as the order block, or whether a given session push counts as a real change of character or just noise. The framework gives vocabulary and a lens for institutional-style price behavior; it doesn't give a mechanical, unambiguous rule for every chart.
That subjectivity is also why the framework's value can't be assumed from the logic alone. A sequence of liquidity grab, structure shift, and gap fill can look compelling in hindsight on a handful of charts without telling you whether it holds up across hundreds of instances, different sessions, or different instruments. Once a trader fixes the exact conditions they act on — which sweep, which gap, which kill zone — that rule set can be measured the same way any trading rule is measured, including with standard performance metrics such as the Sharpe ratio, where a result above 1.0 is generally considered acceptable, above 2.0 very good, and above 3.0 excellent. Reading the mechanics correctly is what makes a strategy legible; it's testing it that shows whether it's worth trusting.